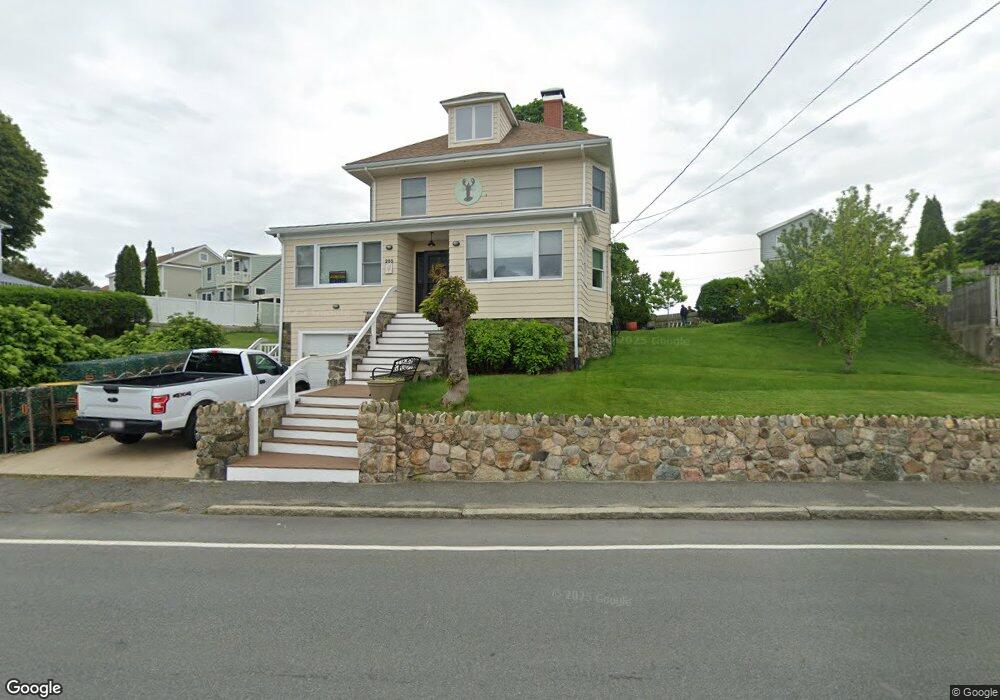
285 Castle Rd Nahant, MA 01908
Estimated Value: $1,049,599 - $1,498,000
About This Home
This home is located at 285 Castle Rd, Nahant, MA 01908 and is currently estimated at $1,173,900, approximately $495 per square foot. 285 Castle Rd is a home located in Essex County with nearby schools including Johnson Elementary School, Swampscott Middle School, and Swampscott High School.
Ownership History
We collect this data history from publicly available records. To have your information removed, we recommend requesting removal directly through your county’s website.
Purchase Details
Purchase Details
Home Values in the Area
Average Home Value in this Area
Purchase History
We collect this data history from publicly available records. To have your information removed, we recommend requesting removal directly through your county’s website.
| Date | Buyer | Sale Price | Title Company |
|---|---|---|---|
| -- | -- | ||
| $120,000 | -- |
Mortgage History
We collect this data history from publicly available records. To have your information removed, we recommend requesting removal directly through your county’s website.
| Date | Status | Borrower | Loan Amount |
|---|---|---|---|
| Closed | $102,000 | ||
| Closed | $60,000 | ||
| Closed | $23,000 |
Tax History
We collect this data history from publicly available records. To have your information removed, we recommend requesting removal directly through your county’s website.
| Year | Tax Paid | Tax Assessment Tax Assessment Total Assessment is a certain percentage of the fair market value that is determined by local assessors to be the total taxable value of land and additions on the property. | Land | Improvement |
|---|---|---|---|---|
| 2025 | $8,989 | $982,400 | $516,100 | $466,300 |
| 2024 | $8,711 | $960,400 | $494,100 | $466,300 |
| 2023 | $8,018 | $882,100 | $439,200 | $442,900 |
| 2022 | $7,550 | $771,200 | $373,300 | $397,900 |
| 2021 | $7,614 | $724,500 | $351,400 | $373,100 |
| 2020 | $7,113 | $648,400 | $329,400 | $319,000 |
| 2019 | $6,466 | $592,700 | $307,500 | $285,200 |
| 2018 | $6,005 | $585,900 | $307,500 | $278,400 |
| 2017 | $6,134 | $585,900 | $307,500 | $278,400 |
| 2016 | $5,640 | $536,100 | $269,000 | $267,100 |
| 2015 | $5,645 | $516,900 | $249,800 | $267,100 |
| 2014 | $5,454 | $494,500 | $227,300 | $267,200 |
Map
- 19 Bay View Ave
- 21 Bay View Ave
- 293 Castle Rd
- 16 Bay View Ave
- 4 Castle Terrace
- 14 Bay View Ave
- 17 Bay View Ave
- 289 Castle Rd
- 20 Bay View Ave
- 12 Bay View Ave Unit 12
- 12 Bay View Ave
- 12 Bay View Ave Unit 2
- 12 Bay View Ave
- 12 Bay View Ave Unit 1
- 10 Bay View Ave
- 295 Castle Rd
- 68 Gardner Rd
- 45 Gardner Rd Unit 2
- 5 Nectar Place
- 34 Bay View Ave
Ask me questions while you tour the home.