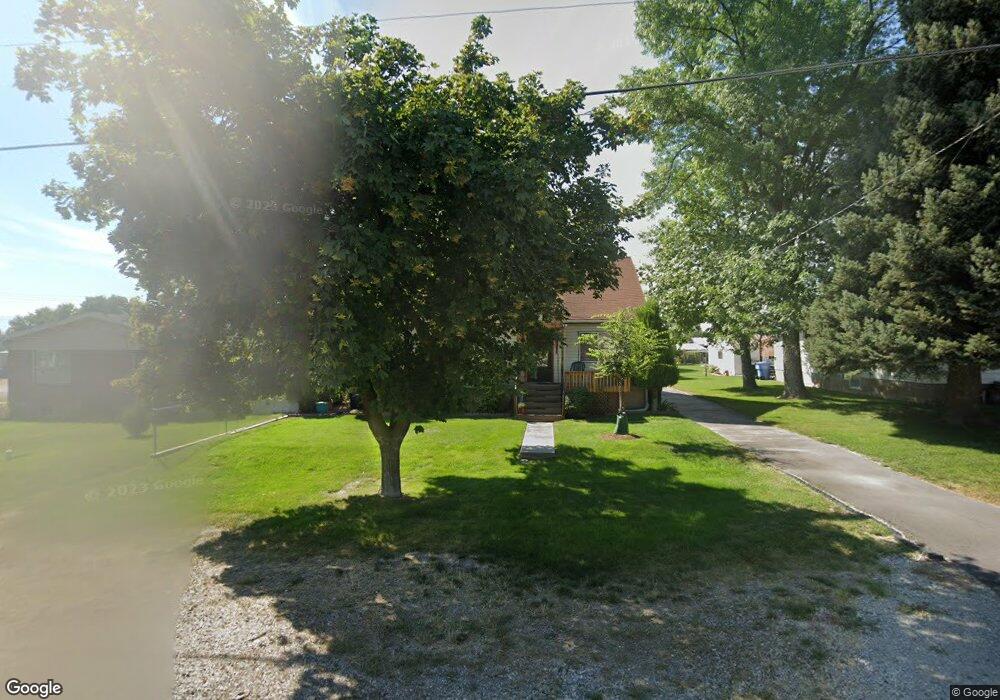
285 S 200 E Smithfield, UT 84335
Estimated Value: $357,906 - $412,000
Studio
--
Bath
1,097
Sq Ft
$342/Sq Ft
Est. Value
About This Home
This home is located at 285 S 200 E, Smithfield, UT 84335 and is currently estimated at $374,977, approximately $341 per square foot. 285 S 200 E is a home with nearby schools including Summit School, Cedar Ridge School, and North Cache Middle School.
Ownership History
Date
Name
Owned For
Owner Type
Purchase Details
Closed on
Sep 5, 2013
Sold by
Robertson Marily J and Robertson Joe
Bought by
Robertson A Joseph and Robertson Marily J
Current Estimated Value
Purchase Details
Closed on
Apr 26, 2001
Sold by
Robertson Marily J
Bought by
Robertson Marily J and Robertson Joe
Create a Home Valuation Report for This Property
The Home Valuation Report is an in-depth analysis detailing your home's value as well as a comparison with similar homes in the area
Home Values in the Area
Average Home Value in this Area
Purchase History
| Date | Buyer | Sale Price | Title Company |
|---|---|---|---|
| Robertson A Joseph | -- | None Available | |
| Robertson Marily J | -- | -- |
Source: Public Records
Tax History
| Year | Tax Paid | Tax Assessment Tax Assessment Total Assessment is a certain percentage of the fair market value that is determined by local assessors to be the total taxable value of land and additions on the property. | Land | Improvement |
|---|---|---|---|---|
| 2025 | $1,489 | $199,300 | $0 | $0 |
| 2024 | $1,575 | $197,770 | $0 | $0 |
| 2023 | $1,667 | $197,940 | $0 | $0 |
| 2022 | $1,535 | $179,320 | $0 | $0 |
| 2021 | $1,408 | $251,304 | $64,500 | $186,804 |
| 2020 | $1,250 | $208,196 | $64,500 | $143,696 |
| 2019 | $1,175 | $186,596 | $42,900 | $143,696 |
| 2018 | $1,115 | $171,200 | $42,900 | $128,300 |
| 2017 | $853 | $71,500 | $0 | $0 |
| 2016 | $868 | $71,500 | $0 | $0 |
| 2015 | $871 | $71,500 | $0 | $0 |
| 2014 | $854 | $71,495 | $0 | $0 |
| 2013 | -- | $71,495 | $0 | $0 |
Source: Public Records
Map
Nearby Homes
Your Personal Tour Guide
Ask me questions while you tour the home.