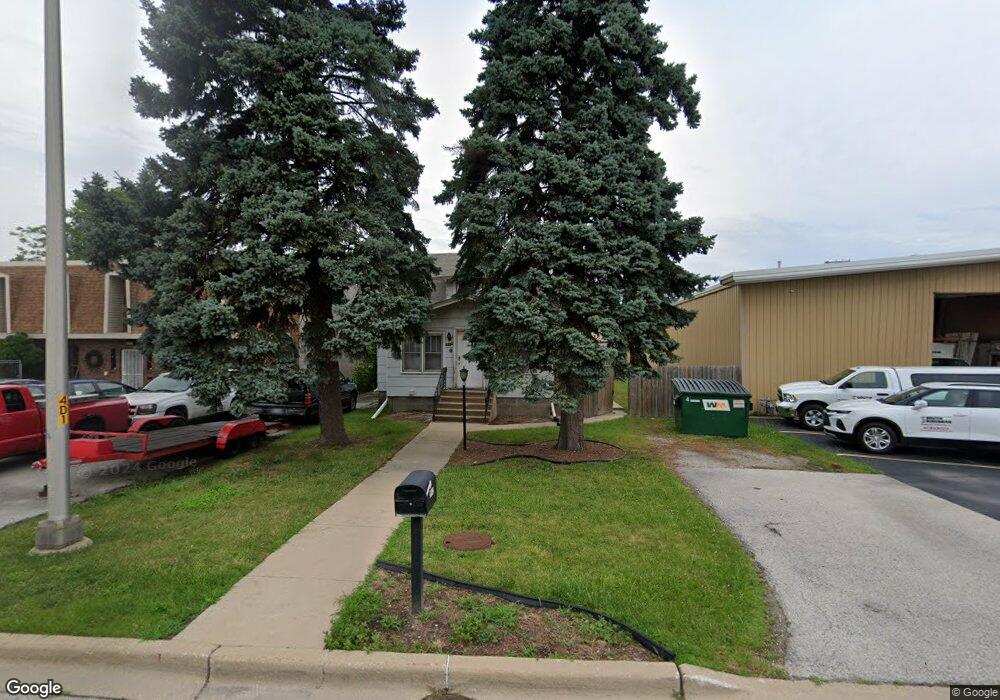
2862 Bernice Ave Lansing, IL 60438
Estimated Value: $148,000 - $191,000
3
Beds
2
Baths
1,400
Sq Ft
$123/Sq Ft
Est. Value
About This Home
This home is located at 2862 Bernice Ave, Lansing, IL 60438 and is currently estimated at $171,769, approximately $122 per square foot. 2862 Bernice Ave is a home located in Cook County with nearby schools including Reavis Elementary School, Memorial Jr High School, and Thornton Fractnl So High School.
Ownership History
Date
Name
Owned For
Owner Type
Purchase Details
Closed on
Jul 6, 2017
Sold by
Anderson Newel
Bought by
Rios Abe
Current Estimated Value
Home Financials for this Owner
Home Financials are based on the most recent Mortgage that was taken out on this home.
Original Mortgage
$48,000
Outstanding Balance
$39,644
Interest Rate
3.94%
Mortgage Type
Seller Take Back
Estimated Equity
$132,125
Purchase Details
Closed on
Jun 1, 2014
Sold by
Komorowski Norman
Bought by
Anderson Newel
Purchase Details
Closed on
Nov 21, 2000
Sold by
Komorowski Donald and Komorowski Ernest
Bought by
Komorowski Kenneth
Purchase Details
Closed on
Oct 22, 1998
Sold by
Cole Taylor Bank
Bought by
Komorowski Kenneth
Home Financials for this Owner
Home Financials are based on the most recent Mortgage that was taken out on this home.
Original Mortgage
$36,577
Interest Rate
8.25%
Create a Home Valuation Report for This Property
The Home Valuation Report is an in-depth analysis detailing your home's value as well as a comparison with similar homes in the area
Home Values in the Area
Average Home Value in this Area
Purchase History
| Date | Buyer | Sale Price | Title Company |
|---|---|---|---|
| Rios Abe | $48,000 | Attorney | |
| Anderson Newel | $73,100 | Cti | |
| Komorowski Kenneth | -- | -- | |
| Komorowski Kenneth | -- | -- |
Source: Public Records
Mortgage History
| Date | Status | Borrower | Loan Amount |
|---|---|---|---|
| Open | Rios Abe | $48,000 | |
| Previous Owner | Komorowski Kenneth | $36,577 |
Source: Public Records
Tax History
| Year | Tax Paid | Tax Assessment Tax Assessment Total Assessment is a certain percentage of the fair market value that is determined by local assessors to be the total taxable value of land and additions on the property. | Land | Improvement |
|---|---|---|---|---|
| 2025 | $4,202 | $12,000 | $2,500 | $9,500 |
| 2024 | $4,202 | $12,000 | $2,500 | $9,500 |
| 2023 | $3,269 | $12,000 | $2,500 | $9,500 |
| 2022 | $3,269 | $8,451 | $2,188 | $6,263 |
| 2021 | $3,236 | $8,450 | $2,187 | $6,263 |
| 2020 | $3,137 | $8,450 | $2,187 | $6,263 |
| 2019 | $3,778 | $10,065 | $2,031 | $8,034 |
| 2018 | $3,704 | $10,065 | $2,031 | $8,034 |
| 2017 | $5,679 | $10,065 | $2,031 | $8,034 |
| 2016 | $4,606 | $8,423 | $1,875 | $6,548 |
| 2015 | $4,279 | $8,423 | $1,875 | $6,548 |
| 2014 | $4,220 | $8,423 | $1,875 | $6,548 |
| 2013 | $4,144 | $9,203 | $1,875 | $7,328 |
Source: Public Records
Map
Nearby Homes
- 3425 Bernice Ave
- 2938 173rd Place
- 3018 Bernice Rd Unit 205
- 3045 Bernice Rd
- 3061 Bernice Rd
- 17303 Chicago Ave
- 3069 Bernice Rd
- 2937 172nd St
- 3127 Bernice Rd Unit 5
- 17303 Greenbay Ave
- 3137 176th St
- 17246 Burnham Ave
- 17318 Walter St
- 17115 Park Ave
- 17617 Burnham Ave
- 17057 Park Ave
- 2736 178th St
- 17518 Roy St
- 17714 Burnham Ave
- 17552 Roy St
- 2858 Bernice Ave
- 2903 Bernice Rd
- 17425 Railroad Ave
- 17425 Railroad Ave
- 17417 Railroad Ave
- 2851 Bernice Rd
- 2851 Bernice Rd
- 2910 Bernice Rd
- 2843 Bernice Rd
- 2864 Bernice Rd
- 2854 Bernice Rd
- 2860 Bernice Rd
- 2850 Bernice Rd
- 17414 Railroad Ave
- 2844 Bernice Rd
- 2940 Bernice Rd Unit 2E
- 2940 Bernice Rd Unit 1E
- 2940 Bernice Rd Unit 1W
- 2940 Bernice Rd Unit 2W
- 2940 Bernice Rd
Your Personal Tour Guide
Ask me questions while you tour the home.