Estimated Value: $376,000 - $412,000
4
Beds
2
Baths
2,100
Sq Ft
$188/Sq Ft
Est. Value
About This Home
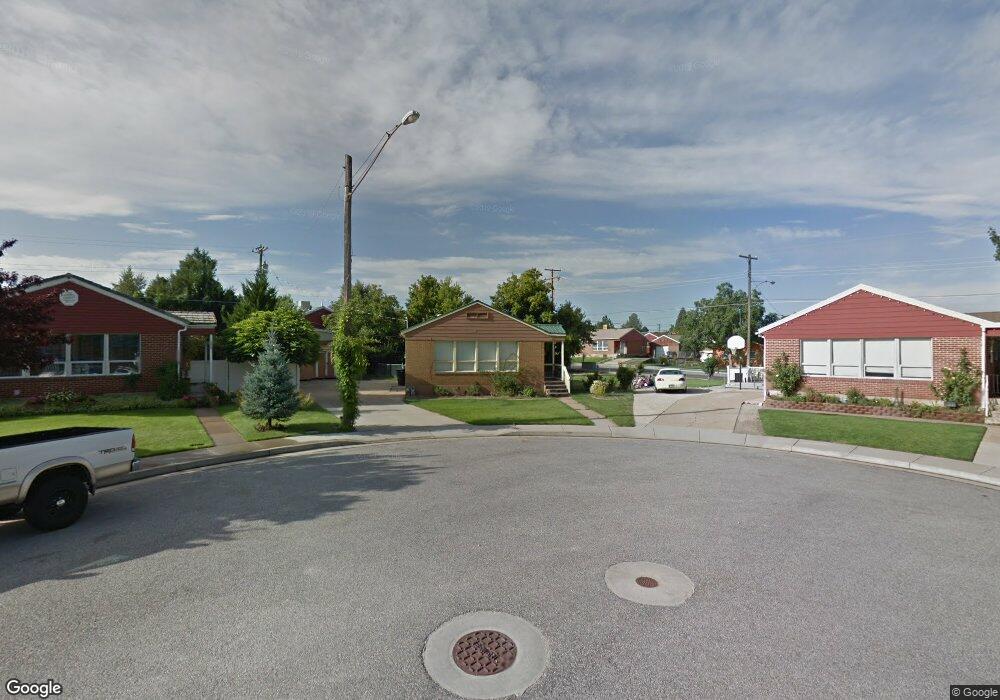
This home is located at 287 W 4775 S, Ogden, UT 84405 and is currently estimated at $394,563, approximately $187 per square foot. 287 W 4775 S is a home located in Weber County with nearby schools including Washington Terrace School, T.H. Bell Junior High School, and Bonneville High School.
Ownership History
Date
Name
Owned For
Owner Type
Purchase Details
Closed on
Feb 4, 2008
Sold by
Bell James and Bell Stephanie
Bought by
Matheson Allyson
Current Estimated Value
Purchase Details
Closed on
Jul 22, 2005
Sold by
Thornock Craig C and Thornock Billi L
Bought by
Thornock Craig Chris and Thornock Billi
Home Financials for this Owner
Home Financials are based on the most recent Mortgage that was taken out on this home.
Original Mortgage
$89,600
Interest Rate
5%
Mortgage Type
Fannie Mae Freddie Mac
Purchase Details
Closed on
Jul 21, 2005
Sold by
Thornock Craig Chris and Thornock Billi
Bought by
Thornock Craig Chris and Thornock Billi L
Home Financials for this Owner
Home Financials are based on the most recent Mortgage that was taken out on this home.
Original Mortgage
$89,600
Interest Rate
5%
Mortgage Type
Fannie Mae Freddie Mac
Create a Home Valuation Report for This Property
The Home Valuation Report is an in-depth analysis detailing your home's value as well as a comparison with similar homes in the area
Home Values in the Area
Average Home Value in this Area
Purchase History
| Date | Buyer | Sale Price | Title Company |
|---|---|---|---|
| Matheson Allyson | -- | American Secure Title Morgan | |
| Thornock Craig Chris | -- | Backman | |
| Thornock Craig Chris | -- | Backman |
Source: Public Records
Mortgage History
| Date | Status | Borrower | Loan Amount |
|---|---|---|---|
| Previous Owner | Thornock Craig Chris | $89,600 | |
| Previous Owner | Thornock Craig Chris | $16,800 |
Source: Public Records
Tax History
| Year | Tax Paid | Tax Assessment Tax Assessment Total Assessment is a certain percentage of the fair market value that is determined by local assessors to be the total taxable value of land and additions on the property. | Land | Improvement |
|---|---|---|---|---|
| 2025 | $2,564 | $378,439 | $118,943 | $259,496 |
| 2024 | $2,440 | $201,849 | $65,418 | $136,431 |
| 2023 | $2,408 | $199,650 | $63,479 | $136,171 |
| 2022 | $2,538 | $219,450 | $60,753 | $158,697 |
| 2021 | $1,924 | $266,000 | $59,488 | $206,512 |
| 2020 | $1,908 | $242,000 | $48,784 | $193,216 |
| 2019 | $1,815 | $212,000 | $48,784 | $163,216 |
| 2018 | $1,591 | $180,000 | $48,784 | $131,216 |
| 2017 | $1,470 | $154,000 | $33,529 | $120,471 |
| 2016 | $1,295 | $72,658 | $17,722 | $54,936 |
| 2015 | $1,249 | $68,218 | $17,722 | $50,496 |
| 2014 | $1,212 | $65,530 | $17,722 | $47,808 |
Source: Public Records
Map
Nearby Homes
Your Personal Tour Guide
Ask me questions while you tour the home.