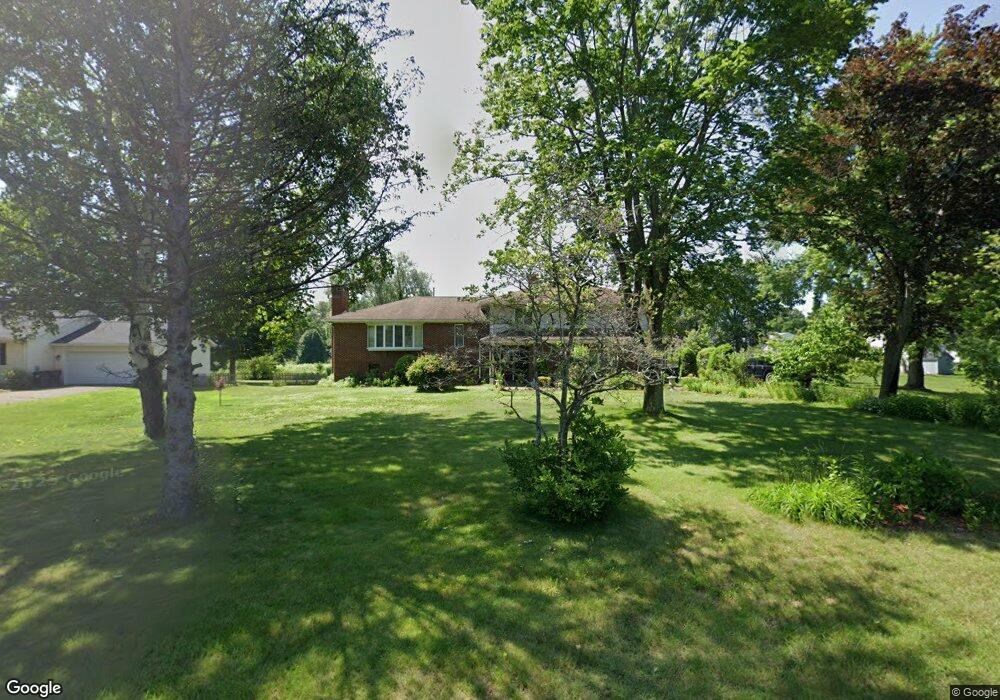
288 Corey St Agawam, MA 01001
Estimated Value: $547,599 - $563,000
About This Home
This home is located at 288 Corey St, Agawam, MA 01001 and is currently estimated at $556,150, approximately $214 per square foot. 288 Corey St is a home located in Hampden County with nearby schools including Agawam Junior High School, Agawam High School, and Veritas Preparatory Charter School.
Ownership History
We collect this data history from publicly available records. To have your information removed, we recommend requesting removal directly through your county’s website.
Purchase Details
Home Values in the Area
Average Home Value in this Area
Purchase History
We collect this data history from publicly available records. To have your information removed, we recommend requesting removal directly through your county’s website.
| Date | Buyer | Sale Price | Title Company |
|---|---|---|---|
| -- | -- |
Mortgage History
We collect this data history from publicly available records. To have your information removed, we recommend requesting removal directly through your county’s website.
| Date | Status | Borrower | Loan Amount |
|---|---|---|---|
| Open | $161,600 | ||
| Closed | $72,300 | ||
| Closed | $191,250 | ||
| Closed | $110,000 |
Tax History
We collect this data history from publicly available records. To have your information removed, we recommend requesting removal directly through your county’s website.
| Year | Tax Paid | Tax Assessment Tax Assessment Total Assessment is a certain percentage of the fair market value that is determined by local assessors to be the total taxable value of land and additions on the property. | Land | Improvement |
|---|---|---|---|---|
| 2025 | $7,692 | $525,400 | $146,400 | $379,000 |
| 2024 | $7,562 | $520,100 | $146,400 | $373,700 |
| 2023 | $6,875 | $435,700 | $132,900 | $302,800 |
| 2022 | $6,499 | $403,400 | $132,900 | $270,500 |
| 2021 | $5,993 | $356,700 | $116,200 | $240,500 |
| 2020 | $6,284 | $373,400 | $114,000 | $259,400 |
| 2019 | $6,124 | $367,800 | $111,000 | $256,800 |
| 2018 | $5,855 | $352,500 | $109,800 | $242,700 |
| 2017 | $5,604 | $343,600 | $109,800 | $233,800 |
| 2016 | $5,394 | $333,400 | $109,800 | $223,600 |
| 2015 | $5,169 | $328,400 | $109,800 | $218,600 |
Map
- 35 Jennie Cir
- 88 Jennie Cir
- 74 Plantation Dr
- 29 Plantation Dr Unit 29
- 70 Corey Colonial
- 15 Plantation Dr
- 282 Regency Park Dr
- 288 Regency Park Dr
- 73 Regency Park Dr
- 53 Corey Colonial
- 272 Regency Park Dr
- 69 Alhambra Cir S
- 40 Simpson Cir
- 58 Beekman Dr
- 38 Alhambra Cir S
- 202 Beekman Dr
- 117 Beekman Dr
- 119 Beekman Dr
- 1159 River Rd
- 77 Glendale Rd
Ask me questions while you tour the home.