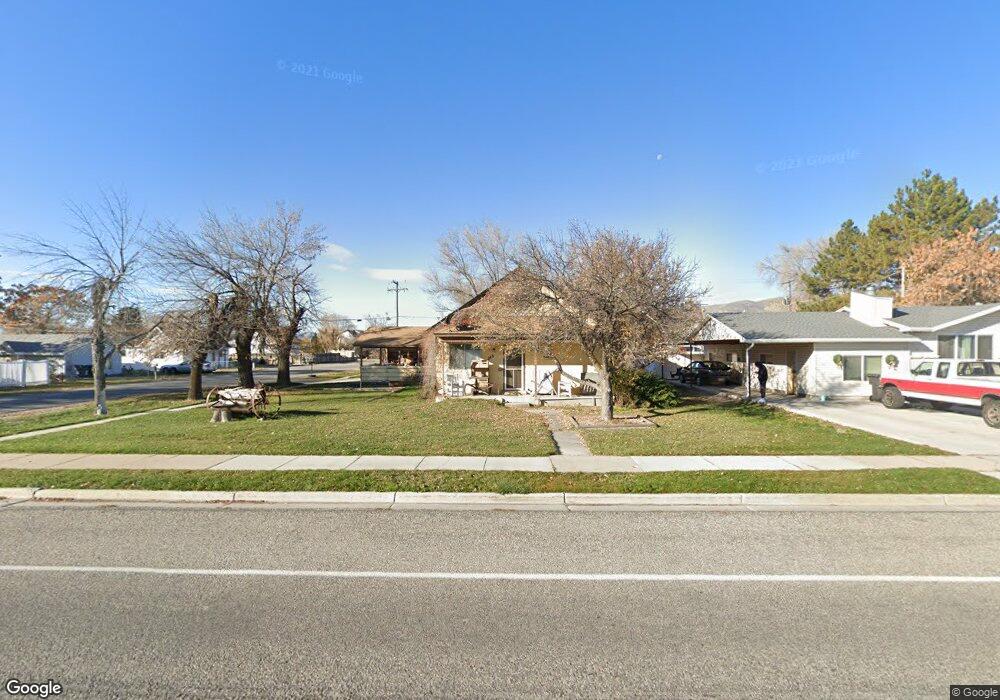
288 S Main St Garland, UT 84312
Estimated Value: $314,656 - $355,000
Studio
--
Bath
1,293
Sq Ft
$252/Sq Ft
Est. Value
About This Home
This home is located at 288 S Main St, Garland, UT 84312 and is currently estimated at $325,664, approximately $251 per square foot. 288 S Main St is a home with nearby schools including Garland School, Bear River Middle School, and Alice C. Harris Intermediate School.
Ownership History
Date
Name
Owned For
Owner Type
Purchase Details
Closed on
Nov 14, 2022
Sold by
Hulce Jeneanne
Bought by
Powers Mistee
Current Estimated Value
Purchase Details
Closed on
Mar 6, 2018
Sold by
Wood Jeneanne R
Bought by
Hulce Jeneanne R and Wood Jeneanne R
Home Financials for this Owner
Home Financials are based on the most recent Mortgage that was taken out on this home.
Original Mortgage
$94,400
Interest Rate
4.15%
Mortgage Type
New Conventional
Create a Home Valuation Report for This Property
The Home Valuation Report is an in-depth analysis detailing your home's value as well as a comparison with similar homes in the area
Home Values in the Area
Average Home Value in this Area
Purchase History
We collect this data history from publicly available records. To have your information removed, we recommend requesting removal directly through your county’s website.
| Date | Buyer | Sale Price | Title Company |
|---|---|---|---|
| Powers Mistee | -- | None Listed On Document | |
| Powers Mistee | -- | None Listed On Document | |
| Hulce Jeneanne R | -- | American Secure Title Tremon |
Source: Public Records
Mortgage History
We collect this data history from publicly available records. To have your information removed, we recommend requesting removal directly through your county’s website.
| Date | Status | Borrower | Loan Amount |
|---|---|---|---|
| Previous Owner | Hulce Jeneanne R | $94,400 |
Source: Public Records
Tax History
| Year | Tax Paid | Tax Assessment Tax Assessment Total Assessment is a certain percentage of the fair market value that is determined by local assessors to be the total taxable value of land and additions on the property. | Land | Improvement |
|---|---|---|---|---|
| 2025 | $1,921 | $292,966 | $105,000 | $187,966 |
| 2024 | $1,660 | $285,073 | $100,000 | $185,073 |
| 2023 | $1,677 | $283,955 | $90,000 | $193,955 |
| 2022 | $1,577 | $137,755 | $13,750 | $124,005 |
| 2021 | $1,188 | $150,810 | $25,000 | $125,810 |
| 2020 | $1,085 | $150,810 | $25,000 | $125,810 |
| 2019 | $1,017 | $74,985 | $13,750 | $61,235 |
| 2018 | $743 | $51,164 | $13,750 | $37,414 |
| 2017 | $771 | $93,026 | $13,750 | $68,026 |
| 2016 | $732 | $49,382 | $13,750 | $35,632 |
| 2015 | $691 | $46,143 | $13,750 | $32,393 |
| 2014 | $691 | $44,601 | $13,750 | $30,851 |
| 2013 | -- | $44,601 | $13,338 | $31,263 |
Source: Public Records
Map
Nearby Homes
Your Personal Tour Guide
Ask me questions while you tour the home.