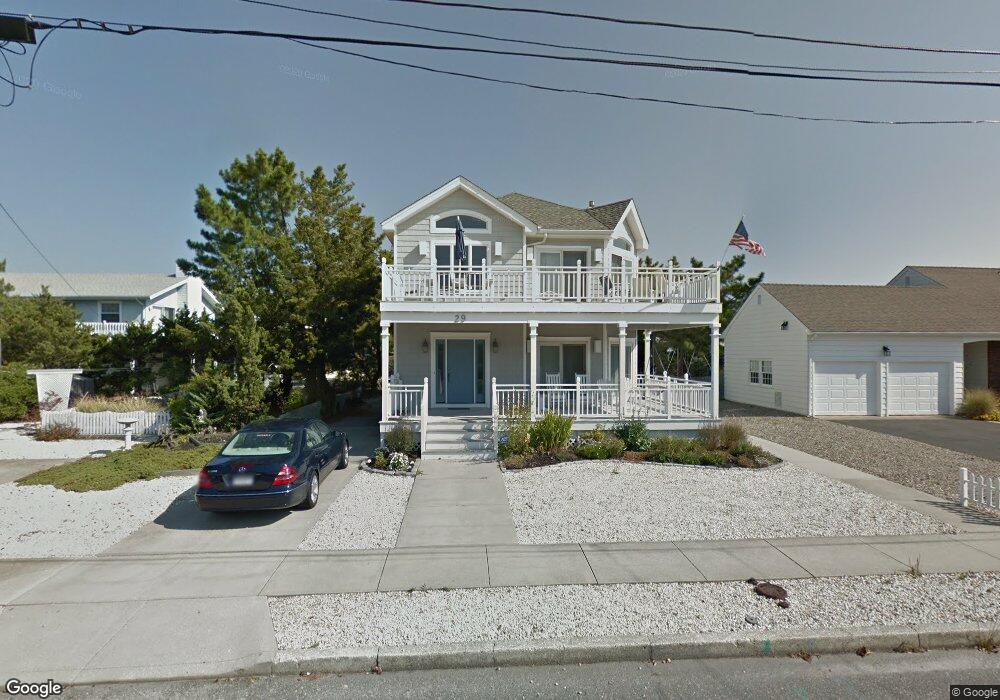
29 19th St E Avalon, NJ 08202
Estimated Value: $3,390,000 - $4,424,000
Studio
--
Bath
2,770
Sq Ft
$1,416/Sq Ft
Est. Value
About This Home
This home is located at 29 19th St E, Avalon, NJ 08202 and is currently estimated at $3,921,956, approximately $1,415 per square foot. 29 19th St E is a home located in Cape May County with nearby schools including Avalon Elementary School.
Ownership History
Date
Name
Owned For
Owner Type
Purchase Details
Closed on
Aug 23, 2018
Sold by
Cutler Carl S
Bought by
Cutler Carol E
Current Estimated Value
Purchase Details
Closed on
Nov 4, 1996
Sold by
Robert M Gorelick Trust
Bought by
Cutler Carl S and Cutler Carole E
Home Financials for this Owner
Home Financials are based on the most recent Mortgage that was taken out on this home.
Original Mortgage
$300,000
Interest Rate
8.1%
Purchase Details
Closed on
May 29, 1992
Sold by
South Jersey Management Corp
Bought by
Gorelick David and Gorelick Robert
Purchase Details
Closed on
Feb 18, 1989
Sold by
Rice William and Rice Suzanne
Bought by
South Jersey Management Corp
Create a Home Valuation Report for This Property
The Home Valuation Report is an in-depth analysis detailing your home's value as well as a comparison with similar homes in the area
Home Values in the Area
Average Home Value in this Area
Purchase History
| Date | Buyer | Sale Price | Title Company |
|---|---|---|---|
| Cutler Carol E | -- | -- | |
| Cutler Carl S | $260,000 | -- | |
| Gorelick David | $275,000 | -- | |
| South Jersey Management Corp | $300,000 | -- |
Source: Public Records
Mortgage History
| Date | Status | Borrower | Loan Amount |
|---|---|---|---|
| Previous Owner | Cutler Carl S | $300,000 |
Source: Public Records
Tax History
| Year | Tax Paid | Tax Assessment Tax Assessment Total Assessment is a certain percentage of the fair market value that is determined by local assessors to be the total taxable value of land and additions on the property. | Land | Improvement |
|---|---|---|---|---|
| 2025 | $13,691 | $2,229,800 | $1,700,000 | $529,800 |
| 2024 | $13,691 | $2,229,800 | $1,700,000 | $529,800 |
| 2023 | $13,579 | $2,229,800 | $1,700,000 | $529,800 |
| 2022 | $12,665 | $2,229,800 | $1,700,000 | $529,800 |
| 2021 | $12,173 | $2,229,800 | $1,700,000 | $529,800 |
| 2020 | $11,729 | $2,229,800 | $1,700,000 | $529,800 |
| 2019 | $11,372 | $2,229,800 | $1,700,000 | $529,800 |
| 2018 | $10,881 | $2,229,800 | $1,700,000 | $529,800 |
| 2017 | $10,492 | $1,887,000 | $1,400,000 | $487,000 |
| 2016 | $10,379 | $1,887,000 | $1,400,000 | $487,000 |
| 2015 | $10,209 | $1,887,000 | $1,400,000 | $487,000 |
| 2014 | $10,095 | $1,887,000 | $1,400,000 | $487,000 |
Source: Public Records
Map
Nearby Homes
Your Personal Tour Guide
Ask me questions while you tour the home.