29 Abigail St Milford, CT 06460
Woodmont NeighborhoodEstimated Value: $842,000 - $2,010,000
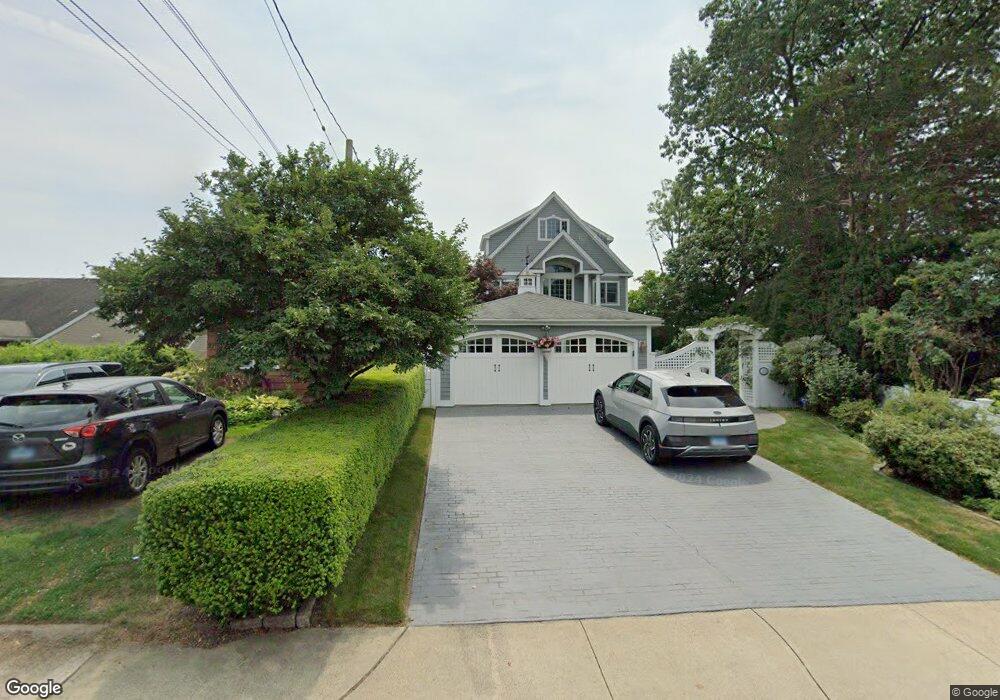
About This Home
This home is located at 29 Abigail St, Milford, CT 06460 and is currently estimated at $1,352,460, approximately $371 per square foot. 29 Abigail St is a home located in New Haven County with nearby schools including Live Oaks School, East Shore Middle School, and Joseph A. Foran High School.
Ownership History
We collect this data history from publicly available records. To have your information removed, we recommend requesting removal directly through your county’s website.
Purchase Details
Home Financials for this Owner
Home Financials are based on the most recent Mortgage that was taken out on this home.Home Values in the Area
Average Home Value in this Area
Purchase History
We collect this data history from publicly available records. To have your information removed, we recommend requesting removal directly through your county’s website.
| Date | Buyer | Sale Price | Title Company |
|---|---|---|---|
| $280,000 | -- | ||
| $280,000 | -- |
Mortgage History
We collect this data history from publicly available records. To have your information removed, we recommend requesting removal directly through your county’s website.
| Date | Status | Borrower | Loan Amount |
|---|---|---|---|
| Open | $300,000 | ||
| Closed | $224,000 |
Tax History
We collect this data history from publicly available records. To have your information removed, we recommend requesting removal directly through your county’s website.
| Year | Tax Paid | Tax Assessment Tax Assessment Total Assessment is a certain percentage of the fair market value that is determined by local assessors to be the total taxable value of land and additions on the property. | Land | Improvement |
|---|---|---|---|---|
| 2025 | $26,661 | $902,250 | $491,400 | $410,850 |
| 2024 | $26,292 | $902,250 | $491,400 | $410,850 |
| 2023 | $24,514 | $902,250 | $491,400 | $410,850 |
| 2022 | $24,045 | $902,250 | $491,400 | $410,850 |
| 2021 | $21,650 | $783,000 | $411,960 | $371,040 |
| 2020 | $21,673 | $783,000 | $411,960 | $371,040 |
| 2019 | $21,697 | $783,000 | $411,960 | $371,040 |
| 2018 | $21,720 | $783,000 | $411,960 | $371,040 |
| 2017 | $21,760 | $783,000 | $411,960 | $371,040 |
| 2016 | $25,119 | $902,280 | $535,190 | $367,090 |
| 2015 | $25,156 | $902,280 | $535,190 | $367,090 |
| 2014 | $24,560 | $902,280 | $535,190 | $367,090 |
Map
- 114 Merwin Ave
- 152 Beach Ave Unit D
- 152 Beach Ave Unit A
- 152 Beach Ave Unit C
- 217 Merwin Ave
- 81 Sandpiper Crescent Unit 81
- 77 Merwin Ave Unit A
- 108 Sandpiper Crescent
- 106 Hawley Ave
- 1 Merwin Ave Unit A1
- 22 Seabreeze Ave Unit A
- 233 Chapel St
- 4 Seabreeze Ave Unit B
- 29 Meetinghouse Ln
- 37 Dunbar Rd
- 136 Hillside Ave
- 330 Merwin Ave Unit D5
- 12 Usher St
- 39 Soundview Ave
- 52 Salem Walk
Ask me questions while you tour the home.