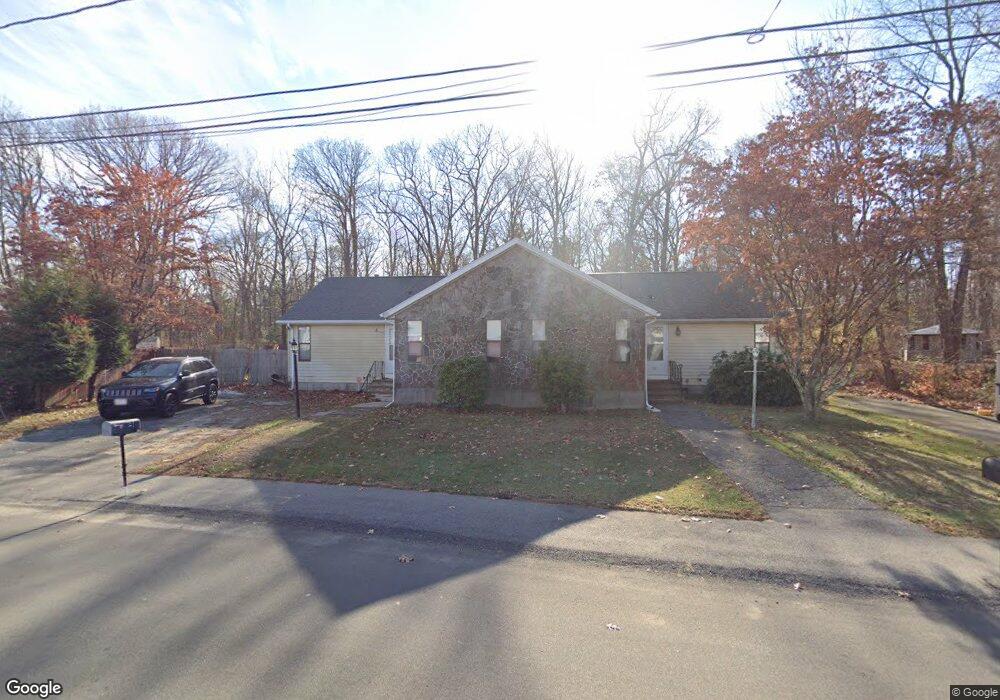
29 Acorn Dr Randolph, MA 02368
South Randolph NeighborhoodEstimated Value: $393,820 - $486,000
2
Beds
2
Baths
1,064
Sq Ft
$418/Sq Ft
Est. Value
About This Home
This home is located at 29 Acorn Dr, Randolph, MA 02368 and is currently estimated at $444,455, approximately $417 per square foot. 29 Acorn Dr is a home located in Norfolk County with nearby schools including Randolph High School and Lighthouse Baptist Christian Academy.
Ownership History
Date
Name
Owned For
Owner Type
Purchase Details
Closed on
Aug 22, 2025
Sold by
Pearlman Bruce A
Bought by
Bruce A Pearlman Ret and Pearlman
Current Estimated Value
Purchase Details
Closed on
Mar 11, 2009
Sold by
Pearlman Theodore and Pearlman Gertrude
Bought by
Pearlman Bruce
Create a Home Valuation Report for This Property
The Home Valuation Report is an in-depth analysis detailing your home's value as well as a comparison with similar homes in the area
Home Values in the Area
Average Home Value in this Area
Purchase History
We collect this data history from publicly available records. To have your information removed, we recommend requesting removal directly through your county’s website.
| Date | Buyer | Sale Price | Title Company |
|---|---|---|---|
| Bruce A Pearlman Ret | -- | -- | |
| Pearlman Bruce | -- | -- | |
| Pearlman Bruce | -- | -- |
Source: Public Records
Mortgage History
We collect this data history from publicly available records. To have your information removed, we recommend requesting removal directly through your county’s website.
| Date | Status | Borrower | Loan Amount |
|---|---|---|---|
| Previous Owner | Pearlman Bruce | $10,000 |
Source: Public Records
Tax History
| Year | Tax Paid | Tax Assessment Tax Assessment Total Assessment is a certain percentage of the fair market value that is determined by local assessors to be the total taxable value of land and additions on the property. | Land | Improvement |
|---|---|---|---|---|
| 2025 | $3,957 | $340,800 | $0 | $340,800 |
| 2024 | $3,736 | $326,300 | $0 | $326,300 |
| 2023 | $3,155 | $261,200 | $0 | $261,200 |
| 2022 | $3,769 | $277,100 | $0 | $277,100 |
| 2021 | $3,269 | $221,200 | $0 | $221,200 |
| 2020 | $3,145 | $210,900 | $0 | $210,900 |
| 2019 | $2,605 | $173,900 | $0 | $173,900 |
| 2018 | $2,469 | $155,500 | $0 | $155,500 |
| 2017 | $2,532 | $156,500 | $0 | $156,500 |
| 2016 | $2,464 | $141,700 | $0 | $141,700 |
| 2015 | $2,415 | $133,400 | $0 | $133,400 |
Source: Public Records
Map
Nearby Homes
- 747 S Main St
- 150 E High St
- 66 Frederickson Dr
- 10 N Glenway Ave
- 192 E Spring St
- 499 South St
- 595 South St
- 193 E Spring St
- 191 E Spring St
- 196 E Main St Unit C
- 38 Druid Hill Ave E
- 15 Jefferson Rd
- 71 W Spring St
- 14 Leonard Ln
- 4 Ell Rd
- 12 Brentwood Ave
- 35 Hillsdale Rd
- 27 Morgan Rd
- 447 E Main St
- 301 Highland Ave
Your Personal Tour Guide
Ask me questions while you tour the home.