Estimated Value: $499,748 - $577,000
Studio
--
Bath
1,956
Sq Ft
$281/Sq Ft
Est. Value
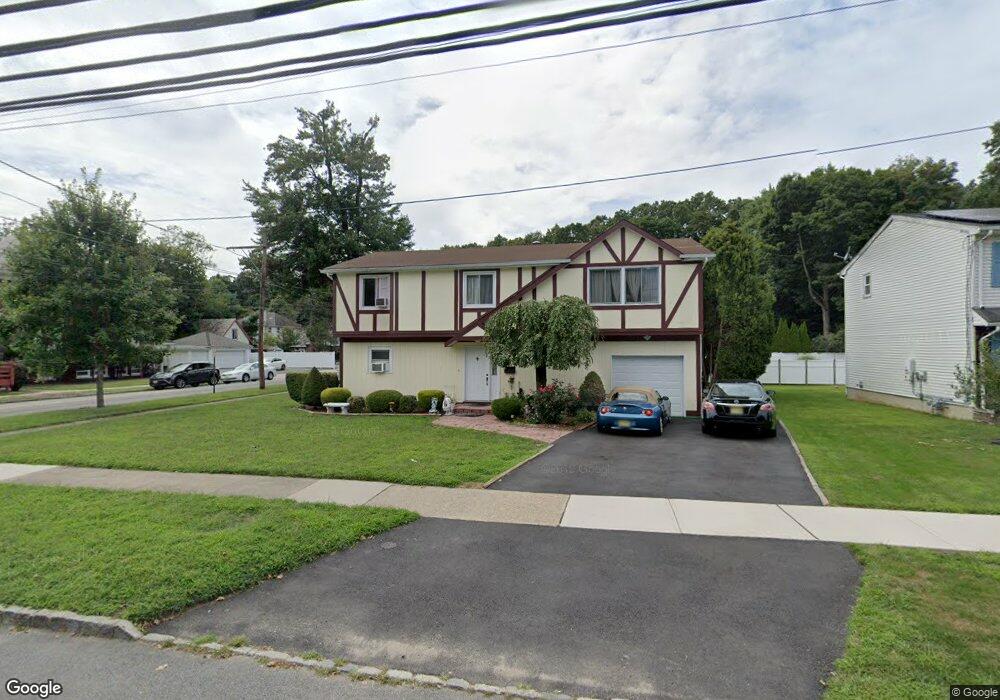
About This Home
This home is located at 29 Baker Ave, Dover, NJ 07801 and is currently estimated at $548,937, approximately $280 per square foot. 29 Baker Ave is a home located in Morris County with nearby schools including Dover Middle School and Dover High School.
Ownership History
Date
Name
Owned For
Owner Type
Purchase Details
Closed on
Aug 26, 2021
Sold by
Alonso Cruz Jessica
Bought by
Cruz Jessica Alonso and Flores Norma P
Current Estimated Value
Purchase Details
Closed on
Jul 31, 2009
Sold by
Cruz Jessica A and Ramos David
Bought by
Cruz Jessica A
Purchase Details
Closed on
Sep 28, 2000
Sold by
Kavrazonis Peter C and Kavrazonis Maria
Bought by
Cruz Jessica A and Ramos David
Home Financials for this Owner
Home Financials are based on the most recent Mortgage that was taken out on this home.
Original Mortgage
$190,900
Interest Rate
7.81%
Mortgage Type
FHA
Create a Home Valuation Report for This Property
The Home Valuation Report is an in-depth analysis detailing your home's value as well as a comparison with similar homes in the area
Home Values in the Area
Average Home Value in this Area
Purchase History
| Date | Buyer | Sale Price | Title Company |
|---|---|---|---|
| Cruz Jessica Alonso | -- | New Title Company Name | |
| Cruz Jessica A | -- | None Available | |
| Cruz Jessica A | $191,000 | -- |
Source: Public Records
Mortgage History
| Date | Status | Borrower | Loan Amount |
|---|---|---|---|
| Previous Owner | Cruz Jessica A | $190,900 |
Source: Public Records
Tax History
| Year | Tax Paid | Tax Assessment Tax Assessment Total Assessment is a certain percentage of the fair market value that is determined by local assessors to be the total taxable value of land and additions on the property. | Land | Improvement |
|---|---|---|---|---|
| 2025 | $9,852 | $301,000 | $135,100 | $165,900 |
| 2024 | $9,503 | $301,000 | $135,100 | $165,900 |
Source: Public Records
Map
Nearby Homes
- 8 N Elk Ave
- 126 Princeton Ave
- 4 Terry Ln
- 25 Wabash Ave
- 417 W Black Well St Ab
- 142 W Blackwell St
- 170 Park Heights Ave
- 79 Ann St
- 13 James St
- 5 A&B Dewey St
- 113 Pequannock St
- 179 Pequannock St
- 62 Union St
- 4 Sickle St
- 104 E Central Ave
- 42 5th Ave
- 00 5th Ave
- 6-16 E Blackwell St Unit 2D
- 6-16 E Blackwell St Unit 2C
- 9 Bissell St
Your Personal Tour Guide
Ask me questions while you tour the home.