29 Ball Ave Bridgewater, MA 02324
Estimated Value: $472,749 - $622,000
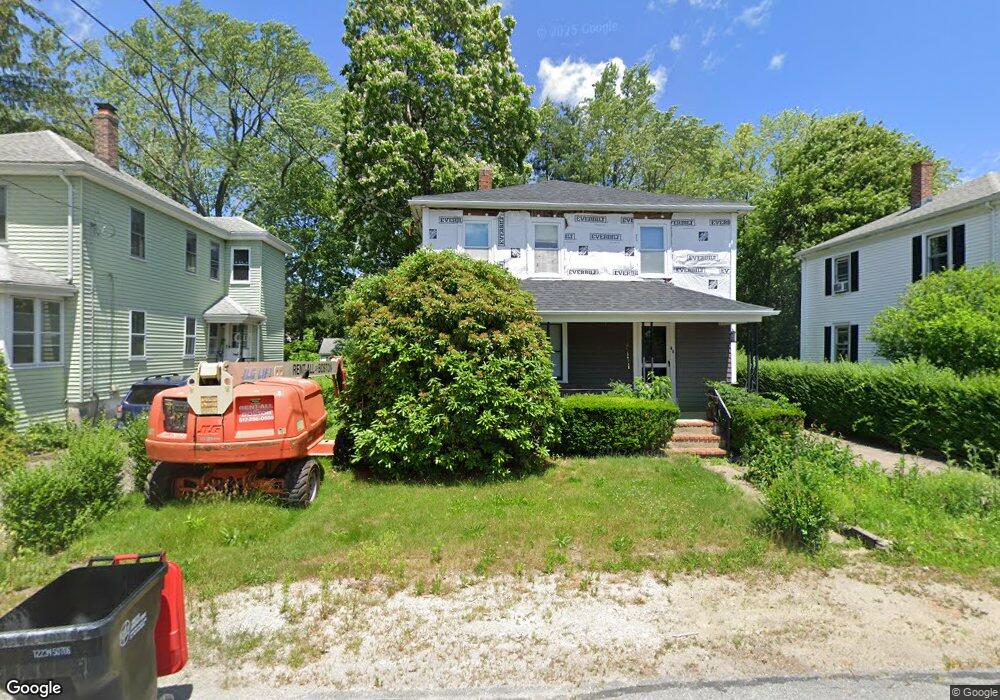
About This Home
This home is located at 29 Ball Ave, Bridgewater, MA 02324 and is currently estimated at $544,937, approximately $380 per square foot. 29 Ball Ave is a home located in Plymouth County with nearby schools including Mitchell Elementary School, Williams Intermediate School, and Bridgewater Middle School.
Ownership History
We collect this data history from publicly available records. To have your information removed, we recommend requesting removal directly through your county’s website.
Purchase Details
Purchase Details
Purchase Details
Home Values in the Area
Average Home Value in this Area
Purchase History
We collect this data history from publicly available records. To have your information removed, we recommend requesting removal directly through your county’s website.
| Date | Buyer | Sale Price | Title Company |
|---|---|---|---|
| -- | -- | ||
| -- | -- | ||
| -- | -- | ||
| -- | -- | ||
| -- | -- | ||
| -- | -- |
Tax History
We collect this data history from publicly available records. To have your information removed, we recommend requesting removal directly through your county’s website.
| Year | Tax Paid | Tax Assessment Tax Assessment Total Assessment is a certain percentage of the fair market value that is determined by local assessors to be the total taxable value of land and additions on the property. | Land | Improvement |
|---|---|---|---|---|
| 2025 | $4,817 | $407,200 | $161,900 | $245,300 |
| 2024 | $4,684 | $385,800 | $154,200 | $231,600 |
| 2023 | $4,841 | $377,000 | $160,100 | $216,900 |
| 2022 | $4,744 | $331,300 | $140,500 | $190,800 |
| 2021 | $4,199 | $290,000 | $119,100 | $170,900 |
| 2020 | $3,962 | $269,000 | $114,500 | $154,500 |
| 2019 | $3,716 | $250,600 | $114,500 | $136,100 |
| 2018 | $3,176 | $209,100 | $111,200 | $97,900 |
| 2017 | $3,158 | $202,300 | $111,200 | $91,100 |
| 2016 | $3,072 | $197,700 | $109,100 | $88,600 |
| 2015 | $3,016 | $185,700 | $100,300 | $85,400 |
| 2014 | $2,956 | $181,900 | $97,300 | $84,600 |
Map
- 84 Hammond St
- 279 Main St
- 580 Broad St Unit 2
- 580 Broad St Unit 1
- 47 Hale St
- 111 Main St
- 48 Wall St
- 262 Plymouth St
- 229 Comfort St
- 180 Main St Unit 1109
- 180 Main St Unit F147
- 180 Main St Unit B29
- 180 Main St Unit B34
- 180 Main St Unit 1202
- 180 Main St Unit 5109
- 180 Main St Unit B32
- 30 Sanger St
- 456 Main St
- 0 Bedford St Unit 73480500
- 100 Mary Ln Unit 1
Ask me questions while you tour the home.