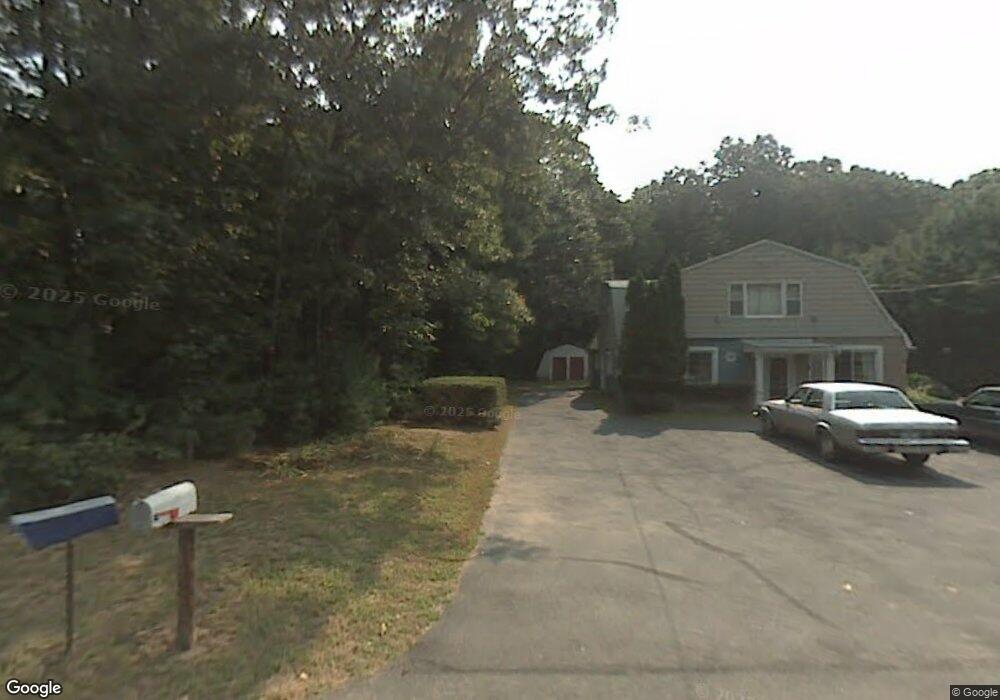
29 Birchwood Rd Windsor, CT 06095
West Windsor NeighborhoodEstimated Value: $338,000 - $446,000
5
Beds
3
Baths
2,976
Sq Ft
$127/Sq Ft
Est. Value
About This Home
This home is located at 29 Birchwood Rd, Windsor, CT 06095 and is currently estimated at $378,511, approximately $127 per square foot. 29 Birchwood Rd is a home located in Hartford County with nearby schools including Poquonock Elementary School, Clover Street School, and Sage Park Middle School.
Ownership History
Date
Name
Owned For
Owner Type
Purchase Details
Closed on
Jun 10, 2011
Sold by
Eckamn Madeline T
Bought by
Brown Christopher
Current Estimated Value
Home Financials for this Owner
Home Financials are based on the most recent Mortgage that was taken out on this home.
Original Mortgage
$177,507
Outstanding Balance
$121,192
Interest Rate
4.81%
Mortgage Type
Purchase Money Mortgage
Estimated Equity
$257,319
Create a Home Valuation Report for This Property
The Home Valuation Report is an in-depth analysis detailing your home's value as well as a comparison with similar homes in the area
Home Values in the Area
Average Home Value in this Area
Purchase History
| Date | Buyer | Sale Price | Title Company |
|---|---|---|---|
| Brown Christopher | $185,000 | -- |
Source: Public Records
Mortgage History
| Date | Status | Borrower | Loan Amount |
|---|---|---|---|
| Open | Brown Christopher | $177,507 | |
| Previous Owner | Brown Christopher | $15,000 |
Source: Public Records
Tax History
| Year | Tax Paid | Tax Assessment Tax Assessment Total Assessment is a certain percentage of the fair market value that is determined by local assessors to be the total taxable value of land and additions on the property. | Land | Improvement |
|---|---|---|---|---|
| 2025 | $5,775 | $203,000 | $56,840 | $146,160 |
| 2024 | $6,155 | $203,000 | $56,840 | $146,160 |
| 2023 | $5,172 | $153,930 | $44,520 | $109,410 |
| 2022 | $5,121 | $153,930 | $44,520 | $109,410 |
| 2021 | $5,121 | $153,930 | $44,520 | $109,410 |
| 2020 | $5,097 | $153,930 | $44,520 | $109,410 |
| 2019 | $4,984 | $153,930 | $44,520 | $109,410 |
| 2018 | $4,386 | $133,070 | $44,520 | $88,550 |
| 2017 | $4,318 | $133,070 | $44,520 | $88,550 |
| 2016 | $4,194 | $133,070 | $44,520 | $88,550 |
| 2015 | $4,115 | $133,070 | $44,520 | $88,550 |
| 2014 | $4,055 | $133,070 | $44,520 | $88,550 |
Source: Public Records
Map
Nearby Homes
- 823 Stone Rd
- 39 Loren Cir
- 999 Stone Rd
- 49 Seymour Rd
- 19 Chelsea Ln Unit 19
- 25 Nutmeg Rd
- 10 Eastfield Farms Dr
- 31 Woodduck Farms Rd
- 0 Walnut Dr
- 0 Walnut and Larch Dr
- 7 Glen Hollow
- 10 Cleary Ln
- 36 Larch Dr
- 68 Tariffville Rd
- 25 Mountain Rd
- 24 Mary Catherine Cir
- 5 Haskins Rd Unit 5
- 22 Old Hartford Ave Unit 22
- 20 Sanford Ridge Unit 20
- 1 Deanne Lynn Cir
Your Personal Tour Guide
Ask me questions while you tour the home.