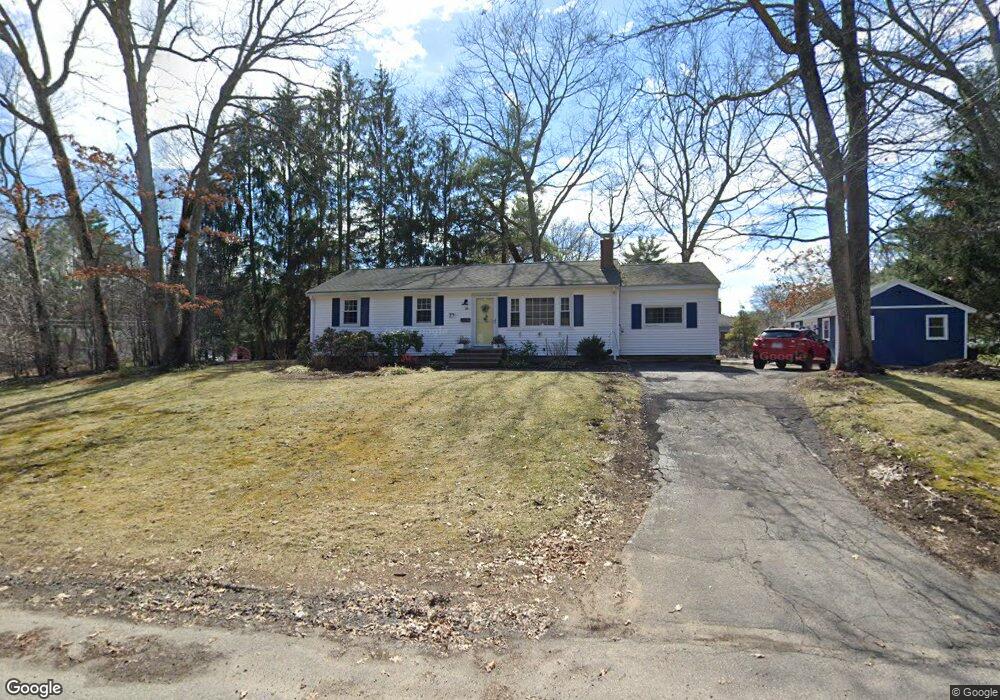
29 Bow St Millis, MA 02054
Estimated Value: $535,089 - $645,000
4
Beds
1
Bath
1,500
Sq Ft
$398/Sq Ft
Est. Value
About This Home
This home is located at 29 Bow St, Millis, MA 02054 and is currently estimated at $596,772, approximately $397 per square foot. 29 Bow St is a home located in Norfolk County with nearby schools including Clyde F Brown, Millis Middle School, and Millis High School.
Ownership History
Date
Name
Owned For
Owner Type
Purchase Details
Closed on
Apr 11, 2006
Sold by
Jensen John and Jensen Laura J
Bought by
Macdonald Bonnie
Current Estimated Value
Home Financials for this Owner
Home Financials are based on the most recent Mortgage that was taken out on this home.
Original Mortgage
$284,000
Outstanding Balance
$156,766
Interest Rate
6.26%
Mortgage Type
Purchase Money Mortgage
Estimated Equity
$440,006
Purchase Details
Closed on
Jun 30, 1999
Sold by
Magley Dale and Magley Grace M
Bought by
Jensen John
Home Financials for this Owner
Home Financials are based on the most recent Mortgage that was taken out on this home.
Original Mortgage
$178,500
Interest Rate
7.19%
Mortgage Type
Purchase Money Mortgage
Create a Home Valuation Report for This Property
The Home Valuation Report is an in-depth analysis detailing your home's value as well as a comparison with similar homes in the area
Home Values in the Area
Average Home Value in this Area
Purchase History
| Date | Buyer | Sale Price | Title Company |
|---|---|---|---|
| Macdonald Bonnie | $355,000 | -- | |
| Jensen John | $187,900 | -- |
Source: Public Records
Mortgage History
| Date | Status | Borrower | Loan Amount |
|---|---|---|---|
| Open | Macdonald Bonnie | $284,000 | |
| Previous Owner | Jensen John | $190,000 | |
| Previous Owner | Jensen John | $178,500 | |
| Previous Owner | Jensen John | $0 |
Source: Public Records
Tax History
| Year | Tax Paid | Tax Assessment Tax Assessment Total Assessment is a certain percentage of the fair market value that is determined by local assessors to be the total taxable value of land and additions on the property. | Land | Improvement |
|---|---|---|---|---|
| 2025 | $8,072 | $492,200 | $239,500 | $252,700 |
| 2024 | $7,711 | $469,600 | $221,000 | $248,600 |
| 2023 | $6,996 | $400,000 | $176,200 | $223,800 |
| 2022 | $7,512 | $397,900 | $189,000 | $208,900 |
| 2021 | $7,134 | $363,600 | $163,400 | $200,200 |
| 2020 | $6,686 | $332,000 | $152,700 | $179,300 |
| 2019 | $5,821 | $311,300 | $140,300 | $171,000 |
| 2018 | $5,610 | $311,300 | $140,300 | $171,000 |
| 2017 | $5,117 | $277,800 | $121,600 | $156,200 |
| 2016 | $4,845 | $277,800 | $121,600 | $156,200 |
| 2015 | $4,723 | $277,800 | $121,600 | $156,200 |
Source: Public Records
Map
Nearby Homes
Your Personal Tour Guide
Ask me questions while you tour the home.