29 Buffum St Salem, MA 01970
North Salem NeighborhoodEstimated Value: $525,000 - $633,000
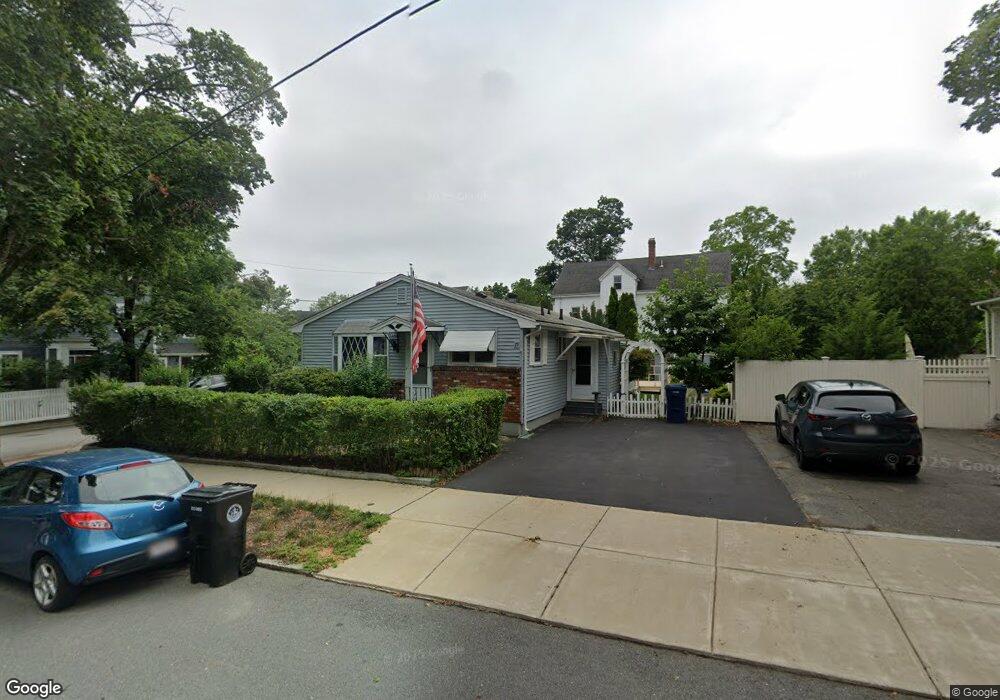
About This Home
This home is located at 29 Buffum St, Salem, MA 01970 and is currently estimated at $590,095, approximately $540 per square foot. 29 Buffum St is a home located in Essex County with nearby schools including Bates Elementary School, Carlton Elementary School, and Saltonstall School.
Ownership History
We collect this data history from publicly available records. To have your information removed, we recommend requesting removal directly through your county’s website.
Purchase Details
Purchase Details
Home Financials for this Owner
Home Financials are based on the most recent Mortgage that was taken out on this home.Home Values in the Area
Average Home Value in this Area
Purchase History
We collect this data history from publicly available records. To have your information removed, we recommend requesting removal directly through your county’s website.
| Date | Buyer | Sale Price | Title Company |
|---|---|---|---|
| -- | -- | ||
| $130,000 | -- |
Mortgage History
We collect this data history from publicly available records. To have your information removed, we recommend requesting removal directly through your county’s website.
| Date | Status | Borrower | Loan Amount |
|---|---|---|---|
| Previous Owner | $65,000 |
Tax History
We collect this data history from publicly available records. To have your information removed, we recommend requesting removal directly through your county’s website.
| Year | Tax Paid | Tax Assessment Tax Assessment Total Assessment is a certain percentage of the fair market value that is determined by local assessors to be the total taxable value of land and additions on the property. | Land | Improvement |
|---|---|---|---|---|
| 2025 | $5,891 | $519,500 | $205,200 | $314,300 |
| 2024 | $5,906 | $508,300 | $195,000 | $313,300 |
| 2023 | $5,663 | $452,700 | $180,000 | $272,700 |
| 2022 | $5,361 | $404,600 | $174,000 | $230,600 |
| 2021 | $5,187 | $375,900 | $162,000 | $213,900 |
| 2020 | $5,056 | $349,900 | $153,000 | $196,900 |
| 2019 | $4,956 | $328,200 | $145,200 | $183,000 |
| 2018 | $4,915 | $319,600 | $138,000 | $181,600 |
| 2017 | $4,650 | $293,200 | $116,400 | $176,800 |
| 2016 | $4,510 | $287,800 | $111,000 | $176,800 |
| 2015 | $4,285 | $261,100 | $102,000 | $159,100 |
Map
- 6 Harmony St
- 137 North St Unit 3
- 42 School St Unit 2
- 44 School St Unit 1
- 146 North St Unit 4
- 146 North St Unit 1
- 57 Buffum St Unit 1
- 24 Mason St
- 12 1/2 Dearborn St Unit 2
- 10 Osborne St Unit B
- 181 North St Unit 105
- 39 Mason St
- 31 Symonds St Unit 20
- 12 Waters St
- 18 Balcomb St Unit B
- 18 Balcomb St
- 2 Dearborn St
- 2 Dearborn St Unit C
- 16 Franklin St Unit 2201
- 16 Franklin St Unit 1502
- 31 Buffum St
- 31 1/2 Buffum St
- 33 Buffum St
- 32 Barr St
- 35 Buffum St
- 35 Buffum St Unit 1
- 35 Buffum St Unit 2
- 68 Harmony St
- 8 Harmony St Unit 8
- 6 Harmony St Unit 6
- 34 Barr St
- 37 Buffum St
- 36 Barr St
- 28 Barr St Unit 30
- 38 Buffum St
- 38 Buffum St Unit 1
- 38 Buffum St Unit 2
- 40 Buffum St
- 40 Buffum St Unit 1
- 40 Buffum St Unit 2
Ask me questions while you tour the home.