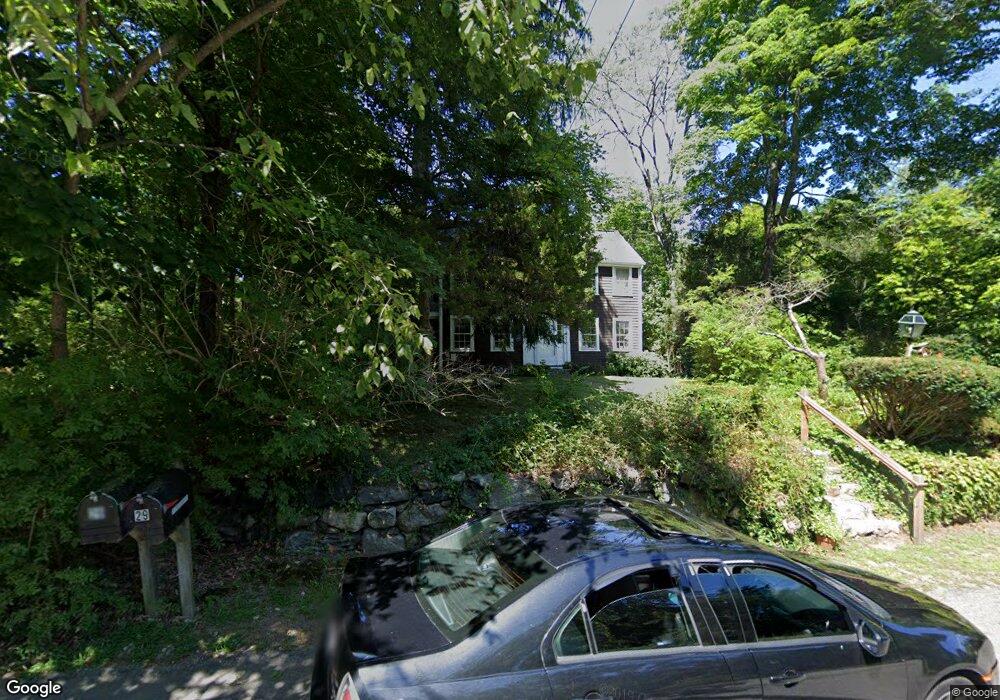
29 Crescent St Weston, MA 02493
Estimated Value: $1,137,000 - $1,309,781
About This Home
This home is located at 29 Crescent St, Weston, MA 02493 and is currently estimated at $1,222,945, approximately $1,019 per square foot. 29 Crescent St is a home located in Middlesex County with nearby schools including Country Elementary School, Woodland Elementary School, and Field Elementary School.
Ownership History
We collect this data history from publicly available records. To have your information removed, we recommend requesting removal directly through your county’s website.
Purchase Details
Purchase Details
Purchase Details
Home Values in the Area
Average Home Value in this Area
Purchase History
We collect this data history from publicly available records. To have your information removed, we recommend requesting removal directly through your county’s website.
| Date | Buyer | Sale Price | Title Company |
|---|---|---|---|
| $969,000 | None Available | ||
| -- | -- | ||
| $240,000 | -- |
Mortgage History
We collect this data history from publicly available records. To have your information removed, we recommend requesting removal directly through your county’s website.
| Date | Status | Borrower | Loan Amount |
|---|---|---|---|
| Previous Owner | $50,000 | ||
| Previous Owner | $225,000 | ||
| Previous Owner | $50,000 |
Tax History
We collect this data history from publicly available records. To have your information removed, we recommend requesting removal directly through your county’s website.
| Year | Tax Paid | Tax Assessment Tax Assessment Total Assessment is a certain percentage of the fair market value that is determined by local assessors to be the total taxable value of land and additions on the property. | Land | Improvement |
|---|---|---|---|---|
| 2025 | $11,722 | $1,056,000 | $917,800 | $138,200 |
| 2024 | $11,677 | $1,050,100 | $917,800 | $132,300 |
| 2023 | $12,199 | $1,030,300 | $917,800 | $112,500 |
| 2022 | $12,380 | $966,400 | $872,000 | $94,400 |
| 2021 | $12,030 | $926,800 | $832,400 | $94,400 |
| 2020 | $11,891 | $926,800 | $832,400 | $94,400 |
| 2019 | $11,643 | $924,800 | $832,400 | $92,400 |
| 2018 | $11,569 | $924,800 | $832,400 | $92,400 |
| 2017 | $11,468 | $924,800 | $832,400 | $92,400 |
| 2016 | $11,246 | $924,800 | $832,400 | $92,400 |
| 2015 | $10,863 | $884,600 | $794,600 | $90,000 |
Map
- 36 Crescent St Unit 36
- 36 Crescent St Unit 1
- 34 Crescent St
- 36 Crescent St
- 34 Crescent St Unit 36
- 34 Crescent St Unit 2
- 36 Crescent St
- 34 Crescent St Unit 34
- 251 Boston Post Rd
- 39 Crescent St
- 256 Boston Post Rd
- 50 Skating Pond Rd
- 16 Crescent St
- 16 Crescent St Unit 16
- 16 Crescent St
- 248 Boston Post Rd
- 21 Crescent St
- 49 Crescent St
- 18 Skating Pond Rd
- 280 Boston Post Rd
Ask me questions while you tour the home.