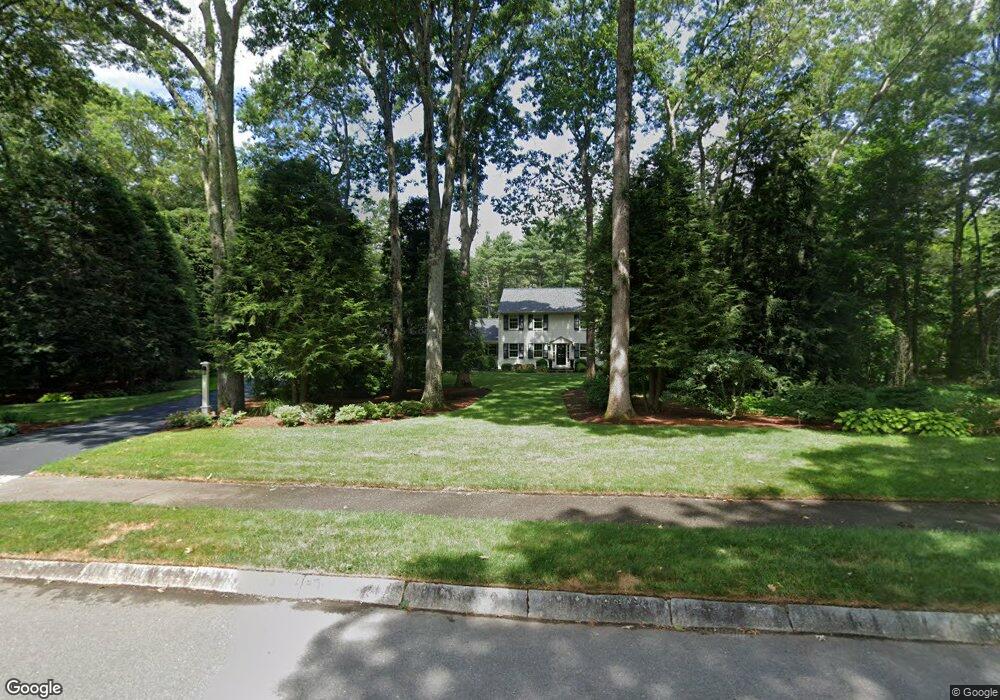
29 Fairway Ln Foxboro, MA 02035
Estimated Value: $895,000 - $1,022,000
About This Home
This home is located at 29 Fairway Ln, Foxboro, MA 02035 and is currently estimated at $962,700, approximately $347 per square foot. 29 Fairway Ln is a home located in Norfolk County with nearby schools including Foxborough High School, Foxborough Regional Charter School, and Hands-On-Montessori School.
Ownership History
We collect this data history from publicly available records. To have your information removed, we recommend requesting removal directly through your county’s website.
Purchase Details
Home Financials for this Owner
Home Financials are based on the most recent Mortgage that was taken out on this home.Home Values in the Area
Average Home Value in this Area
Purchase History
We collect this data history from publicly available records. To have your information removed, we recommend requesting removal directly through your county’s website.
| Date | Buyer | Sale Price | Title Company |
|---|---|---|---|
| $475,000 | -- |
Mortgage History
We collect this data history from publicly available records. To have your information removed, we recommend requesting removal directly through your county’s website.
| Date | Status | Borrower | Loan Amount |
|---|---|---|---|
| Open | $380,000 | ||
| Closed | $47,500 |
Tax History
We collect this data history from publicly available records. To have your information removed, we recommend requesting removal directly through your county’s website.
| Year | Tax Paid | Tax Assessment Tax Assessment Total Assessment is a certain percentage of the fair market value that is determined by local assessors to be the total taxable value of land and additions on the property. | Land | Improvement |
|---|---|---|---|---|
| 2025 | $11,267 | $852,300 | $308,900 | $543,400 |
| 2024 | $10,958 | $811,100 | $308,200 | $502,900 |
| 2023 | $10,498 | $738,800 | $293,900 | $444,900 |
| 2022 | $9,683 | $666,900 | $241,500 | $425,400 |
| 2021 | $9,616 | $652,400 | $235,000 | $417,400 |
| 2020 | $9,303 | $638,500 | $235,000 | $403,500 |
| 2019 | $9,120 | $620,400 | $244,700 | $375,700 |
| 2018 | $8,856 | $607,800 | $244,700 | $363,100 |
| 2017 | $8,686 | $577,500 | $238,700 | $338,800 |
| 2016 | $8,206 | $553,700 | $210,700 | $343,000 |
| 2015 | $8,131 | $535,300 | $174,800 | $360,500 |
| 2014 | $7,849 | $523,600 | $170,100 | $353,500 |
Map
- 26 Fairway Ln
- 3 Milton Ln
- 116 S High St
- 38 West St
- 401 South St
- 226 Central St
- 139 Grove St
- 8 Bicknell St
- 356 Central St
- 9 Green St
- 380 Central St
- 3 Summerville Rd Unit 3
- 9 Orchard Place Unit 9
- 12 Elm St
- 84 Cocasset St Unit B2
- 8 Douglas Dr
- 7 Noonan St
- 1 Ledgeville Ave
- 109 Cocasset St
- 69 Highland Ave
Ask me questions while you tour the home.