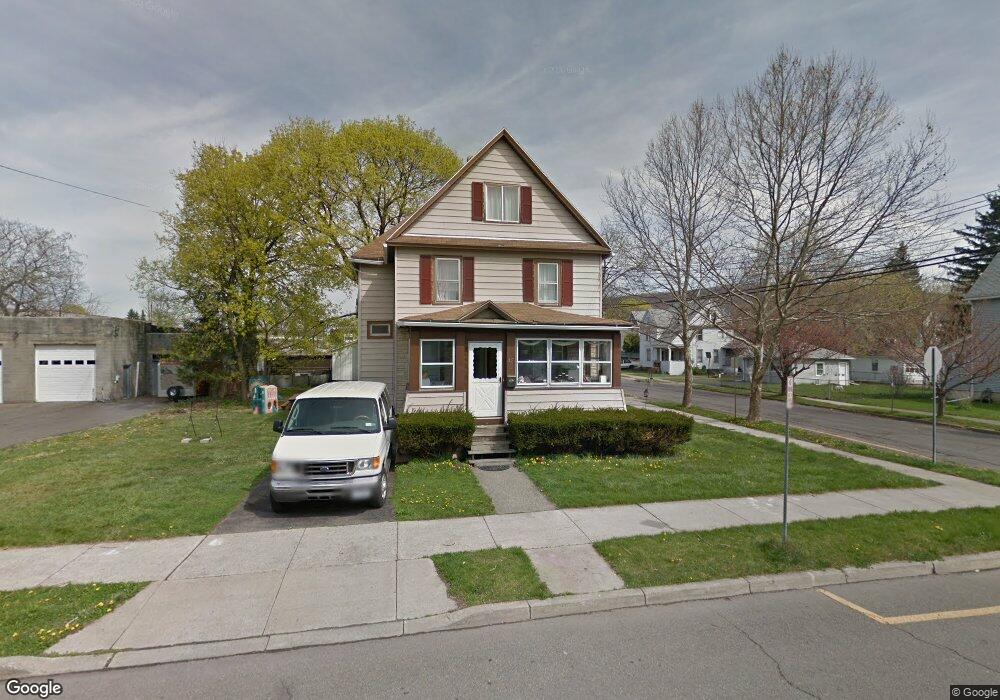
29 George St Binghamton, NY 13904
Eastside Binghamton NeighborhoodEstimated Value: $112,000 - $150,000
3
Beds
1
Bath
1,469
Sq Ft
$85/Sq Ft
Est. Value
About This Home
This home is located at 29 George St, Binghamton, NY 13904 and is currently estimated at $124,839, approximately $84 per square foot. 29 George St is a home located in Broome County with nearby schools including Calvin Coolidge Elementary School, Binghamton High School, and East Middle School.
Ownership History
Date
Name
Owned For
Owner Type
Purchase Details
Closed on
Jan 31, 2007
Sold by
Brown Randy
Bought by
Parsot Daniel
Current Estimated Value
Home Financials for this Owner
Home Financials are based on the most recent Mortgage that was taken out on this home.
Original Mortgage
$55,561
Outstanding Balance
$33,240
Interest Rate
6.24%
Mortgage Type
FHA
Estimated Equity
$91,599
Purchase Details
Closed on
Oct 7, 2006
Sold by
Knickerbocker Donald
Bought by
Brown Randy
Create a Home Valuation Report for This Property
The Home Valuation Report is an in-depth analysis detailing your home's value as well as a comparison with similar homes in the area
Home Values in the Area
Average Home Value in this Area
Purchase History
| Date | Buyer | Sale Price | Title Company |
|---|---|---|---|
| Parsot Daniel | $56,000 | Frederick Xlander | |
| Brown Randy | $30,400 | Frederick Xlander |
Source: Public Records
Mortgage History
| Date | Status | Borrower | Loan Amount |
|---|---|---|---|
| Open | Parsot Daniel | $55,561 |
Source: Public Records
Tax History
| Year | Tax Paid | Tax Assessment Tax Assessment Total Assessment is a certain percentage of the fair market value that is determined by local assessors to be the total taxable value of land and additions on the property. | Land | Improvement |
|---|---|---|---|---|
| 2025 | $4,731 | $48,000 | $7,000 | $41,000 |
| 2024 | $4,731 | $48,000 | $7,000 | $41,000 |
| 2023 | $4,644 | $48,000 | $7,000 | $41,000 |
| 2022 | $4,535 | $48,000 | $7,000 | $41,000 |
| 2021 | $4,484 | $48,000 | $7,000 | $41,000 |
| 2020 | $2,294 | $48,000 | $7,000 | $41,000 |
| 2019 | $1,514 | $48,000 | $7,000 | $41,000 |
| 2018 | $2,220 | $48,000 | $7,000 | $41,000 |
| 2017 | $2,248 | $48,000 | $7,000 | $41,000 |
| 2016 | $2,273 | $48,000 | $7,000 | $41,000 |
| 2015 | $2,020 | $48,000 | $7,000 | $41,000 |
| 2014 | $2,020 | $48,000 | $7,000 | $41,000 |
Source: Public Records
Map
Nearby Homes
Your Personal Tour Guide
Ask me questions while you tour the home.