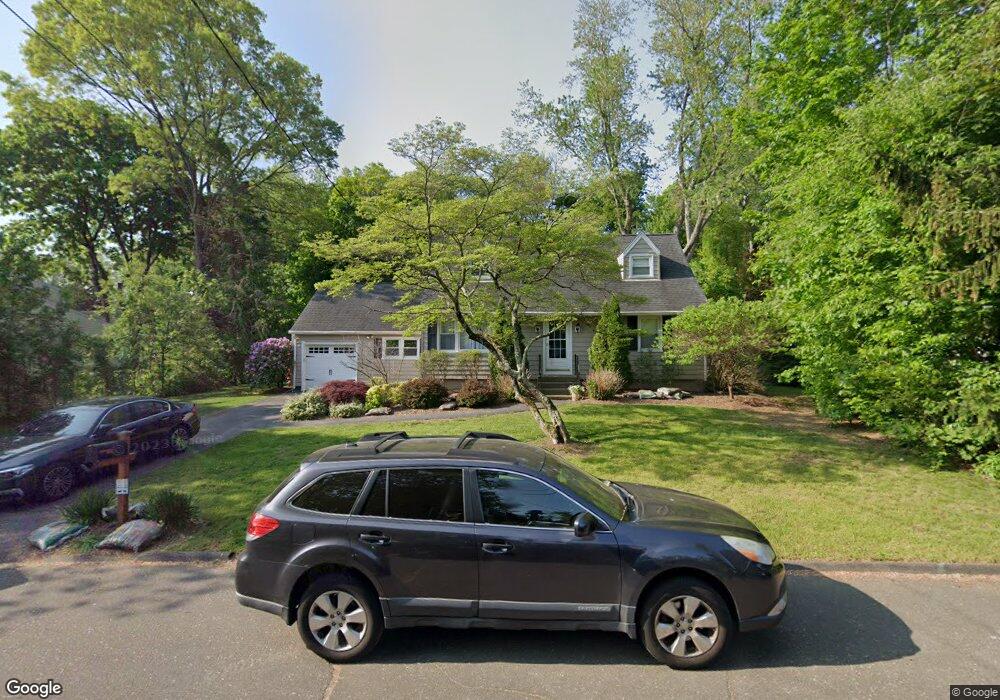
29 Linley Rd Trumbull, CT 06611
Trumbull Center NeighborhoodEstimated Value: $596,463 - $651,000
4
Beds
3
Baths
1,480
Sq Ft
$420/Sq Ft
Est. Value
About This Home
This home is located at 29 Linley Rd, Trumbull, CT 06611 and is currently estimated at $621,866, approximately $420 per square foot. 29 Linley Rd is a home located in Fairfield County with nearby schools including Middlebrook School, Madison Middle School, and Trumbull High School.
Ownership History
Date
Name
Owned For
Owner Type
Purchase Details
Closed on
May 27, 2005
Sold by
Bizier Peter G and Bizier Sandra G
Bought by
Hoefer Erik and Hoefer Kathleen
Current Estimated Value
Purchase Details
Closed on
Jun 30, 1994
Sold by
Mckeon George and Mckeon Kathleen
Bought by
Bizier Peter and Bizier Sandra
Create a Home Valuation Report for This Property
The Home Valuation Report is an in-depth analysis detailing your home's value as well as a comparison with similar homes in the area
Home Values in the Area
Average Home Value in this Area
Purchase History
We collect this data history from publicly available records. To have your information removed, we recommend requesting removal directly through your county’s website.
| Date | Buyer | Sale Price | Title Company |
|---|---|---|---|
| Hoefer Erik | $410,000 | -- | |
| Bizier Peter | $200,000 | -- |
Source: Public Records
Mortgage History
We collect this data history from publicly available records. To have your information removed, we recommend requesting removal directly through your county’s website.
| Date | Status | Borrower | Loan Amount |
|---|---|---|---|
| Open | Bizier Peter | $306,000 | |
| Closed | Bizier Peter | $324,500 | |
| Closed | Bizier Peter | $325,000 |
Source: Public Records
Tax History
| Year | Tax Paid | Tax Assessment Tax Assessment Total Assessment is a certain percentage of the fair market value that is determined by local assessors to be the total taxable value of land and additions on the property. | Land | Improvement |
|---|---|---|---|---|
| 2025 | $9,748 | $264,040 | $147,840 | $116,200 |
| 2024 | $9,482 | $264,040 | $147,840 | $116,200 |
| 2023 | $9,329 | $264,040 | $147,840 | $116,200 |
| 2022 | $9,179 | $264,040 | $147,840 | $116,200 |
| 2021 | $7,897 | $216,090 | $123,200 | $92,890 |
| 2020 | $7,747 | $216,090 | $123,200 | $92,890 |
| 2018 | $7,556 | $216,090 | $123,200 | $92,890 |
| 2017 | $7,403 | $216,090 | $123,200 | $92,890 |
| 2016 | $7,254 | $216,090 | $123,200 | $92,890 |
| 2015 | $7,387 | $217,500 | $123,200 | $94,300 |
| 2014 | $7,228 | $217,500 | $123,200 | $94,300 |
Source: Public Records
Map
Nearby Homes
- 36 Lillian Dr
- 315 Church Hill Rd
- 28 Grandview Dr
- 58 Daniels Farm Rd
- 22 Country Ln
- 26 Craig Ln
- 220 Algonquin Trail
- 5 Arrowhead Rd
- 12 Sunset Ave
- 50 Crown St
- 212 Algonquin Trail Unit 212
- 6 Winding Way Unit 6
- 286 Daniels Farm Rd
- 54 Redspire Ct Unit 54
- 35 Elberta Ave
- 26 Grove St
- 5385 Main St
- 34 Bassick Rd
- 253 Mayfield Dr Unit 253
- 58 Colony Ave
Your Personal Tour Guide
Ask me questions while you tour the home.