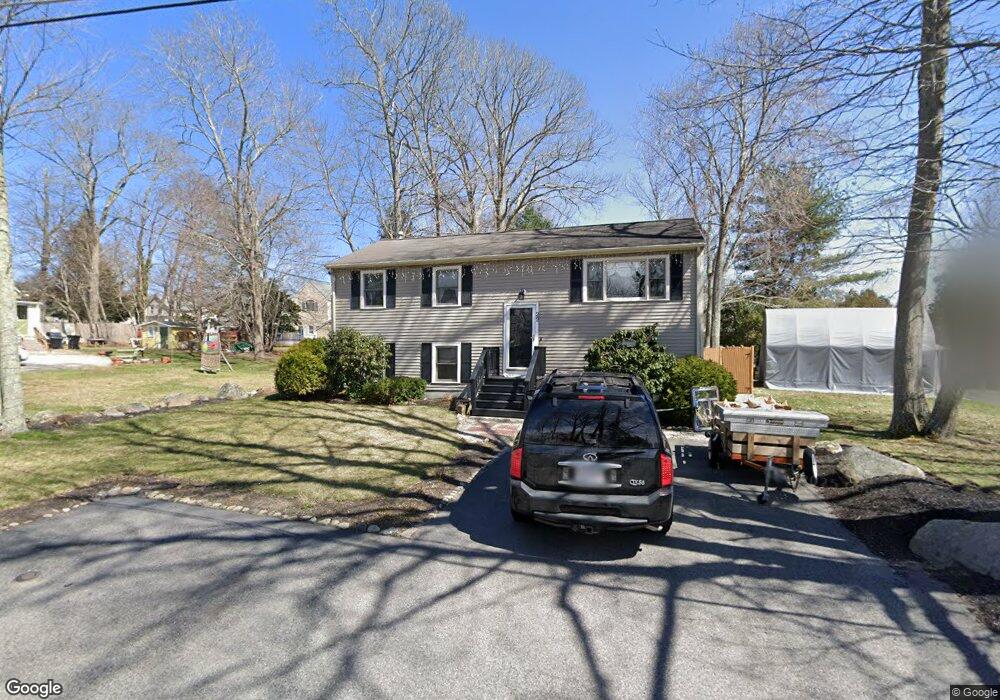
29 Loring Ave Whitman, MA 02382
Estimated Value: $592,879 - $627,000
3
Beds
3
Baths
1,776
Sq Ft
$341/Sq Ft
Est. Value
About This Home
This home is located at 29 Loring Ave, Whitman, MA 02382 and is currently estimated at $606,220, approximately $341 per square foot. 29 Loring Ave is a home located in Plymouth County with nearby schools including Trinity Catholic Academy and Cardinal Spellman High School.
Ownership History
Date
Name
Owned For
Owner Type
Purchase Details
Closed on
Nov 25, 1996
Sold by
Mary Delprete Inc
Bought by
Currier Christopher K and Currier Margaret L
Current Estimated Value
Purchase Details
Closed on
Jul 30, 1996
Sold by
Meier Peter K
Bought by
Mary Delprete Inc
Purchase Details
Closed on
Jun 2, 1992
Sold by
Leitch Richard A
Bought by
Rosen Richard S
Create a Home Valuation Report for This Property
The Home Valuation Report is an in-depth analysis detailing your home's value as well as a comparison with similar homes in the area
Home Values in the Area
Average Home Value in this Area
Purchase History
We collect this data history from publicly available records. To have your information removed, we recommend requesting removal directly through your county’s website.
| Date | Buyer | Sale Price | Title Company |
|---|---|---|---|
| Currier Christopher K | $122,900 | -- | |
| Mary Delprete Inc | $35,000 | -- | |
| Rosen Richard S | $40,000 | -- |
Source: Public Records
Mortgage History
We collect this data history from publicly available records. To have your information removed, we recommend requesting removal directly through your county’s website.
| Date | Status | Borrower | Loan Amount |
|---|---|---|---|
| Open | Rosen Richard S | $185,000 | |
| Closed | Rosen Richard S | $46,700 | |
| Closed | Rosen Richard S | $202,000 |
Source: Public Records
Tax History
| Year | Tax Paid | Tax Assessment Tax Assessment Total Assessment is a certain percentage of the fair market value that is determined by local assessors to be the total taxable value of land and additions on the property. | Land | Improvement |
|---|---|---|---|---|
| 2025 | $6,523 | $497,200 | $199,800 | $297,400 |
| 2024 | $5,758 | $452,000 | $195,900 | $256,100 |
| 2023 | $5,268 | $388,200 | $169,900 | $218,300 |
| 2022 | $5,179 | $355,700 | $154,400 | $201,300 |
| 2021 | $5,180 | $334,200 | $128,400 | $205,800 |
| 2020 | $5,113 | $322,600 | $128,400 | $194,200 |
| 2019 | $4,902 | $318,700 | $128,400 | $190,300 |
| 2018 | $4,723 | $295,000 | $121,600 | $173,400 |
| 2017 | $4,449 | $295,000 | $121,600 | $173,400 |
| 2016 | $4,340 | $278,400 | $120,700 | $157,700 |
| 2015 | $3,995 | $255,900 | $106,200 | $149,700 |
Source: Public Records
Map
Nearby Homes
- 626 Temple St
- 90 Loring Ave
- 300 High St
- 360 High St
- 877 Auburnville Way Unit H7
- 534 Hogg Memorial Dr
- 33 Hayes Ave
- 56-58 Vernon St
- 728 Auburn St Unit D4
- 26 Alger St
- 456 Beulah St
- 760 Washington St
- 936 Centre St
- 659 Washington St
- 125 High St
- 101 Highfields Rd
- 13 Mahoney Cir
- 37 Lakeview St
- 145 Bates Rd
- 23 Irene Cir
Your Personal Tour Guide
Ask me questions while you tour the home.