29 Mason St Peabody, MA 01960
Peabody Town Center NeighborhoodEstimated Value: $720,000 - $1,080,000
About This Home
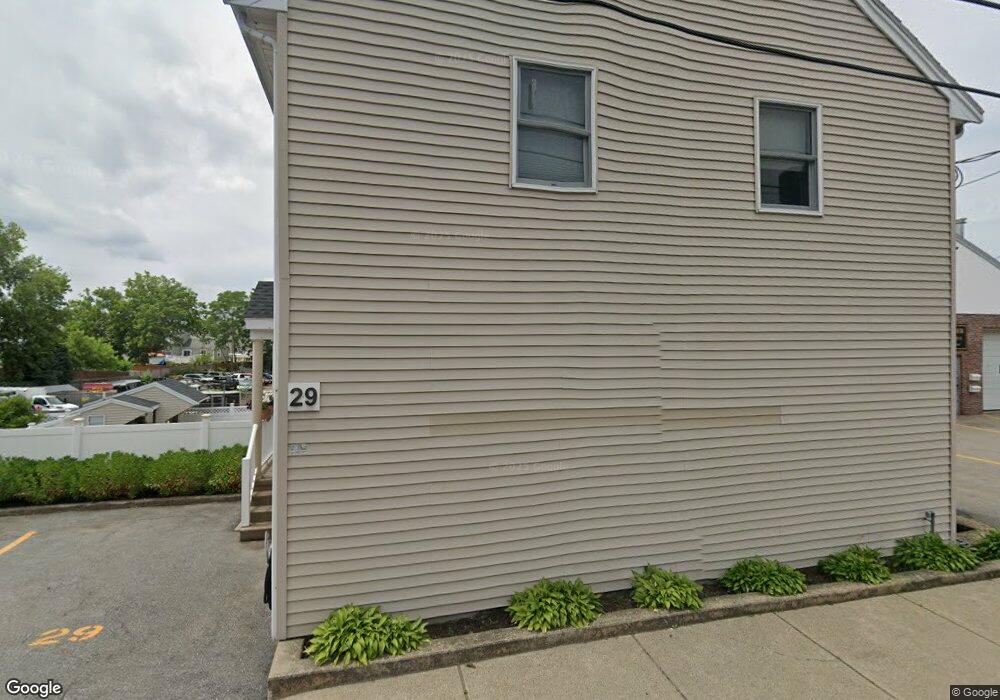
This home is located at 29 Mason St, Peabody, MA 01960 and is currently estimated at $862,247, approximately $251 per square foot. 29 Mason St is a home located in Essex County with nearby schools including Peabody Veterans Memorial High School, St John The Baptist School, and The Phoenix School.
Ownership History
We collect this data history from publicly available records. To have your information removed, we recommend requesting removal directly through your county’s website.
Purchase Details
Home Values in the Area
Average Home Value in this Area
Purchase History
We collect this data history from publicly available records. To have your information removed, we recommend requesting removal directly through your county’s website.
| Date | Buyer | Sale Price | Title Company |
|---|---|---|---|
| $60,000 | -- |
Mortgage History
We collect this data history from publicly available records. To have your information removed, we recommend requesting removal directly through your county’s website.
| Date | Status | Borrower | Loan Amount |
|---|---|---|---|
| Open | $72,500 | ||
| Closed | $107,000 | ||
| Closed | $10,000 | ||
| Closed | $100,000 |
Tax History
We collect this data history from publicly available records. To have your information removed, we recommend requesting removal directly through your county’s website.
| Year | Tax Paid | Tax Assessment Tax Assessment Total Assessment is a certain percentage of the fair market value that is determined by local assessors to be the total taxable value of land and additions on the property. | Land | Improvement |
|---|---|---|---|---|
| 2025 | $7,025 | $758,600 | $224,400 | $534,200 |
| 2024 | $6,083 | $667,000 | $224,400 | $442,600 |
| 2023 | $6,216 | $652,900 | $195,100 | $457,800 |
| 2022 | $5,747 | $569,000 | $174,200 | $394,800 |
| 2021 | $5,629 | $536,600 | $158,400 | $378,200 |
| 2020 | $5,512 | $513,200 | $158,400 | $354,800 |
| 2019 | $5,447 | $494,700 | $158,400 | $336,300 |
| 2018 | $5,047 | $440,400 | $149,400 | $291,000 |
| 2017 | $5,087 | $432,600 | $149,400 | $283,200 |
| 2016 | $5,052 | $423,800 | $149,400 | $274,400 |
| 2015 | $5,034 | $409,300 | $149,800 | $259,500 |
Map
- 80 Foster St Unit 504
- 64 Foster St Unit 403
- 64 Foster St Unit 305
- 149 Washington St
- 18 1/2 Dalton Ct Unit 18 1/2
- 19 Swampscott Ave
- 5 Milk Street Extension
- 26 Beckett St
- 45.5 Aborn St Unit 2
- 72 Aborn St Unit 1
- 20 Beacon St
- 46 Walnut St
- 18 Shillaber St
- 6 Munroe St
- 75 Walnut St Unit 207
- 65 Ord St
- 112 Lowell St Unit 11
- 10 Crowninshield St Unit 106
- 16 Palmer Ave Unit 2
- 25 Bow St
- 27 Mason St
- 27R Mason St Lot 3b1
- 27R Mason St
- 24 Mason St
- 22 Mason St
- 26 Mason St
- 18 Mason St
- 28 Mason St
- 31 Mason St
- 100 Birney St Unit A3
- 100 Birney St Unit A7
- 100 Birney St Unit A1,A2
- 100 Birney St Unit A2,A3
- 100 Birney St
- 30 Mason St
- 16 Washington Place
- 16 Washington Place Unit 1
- 16 Washington Place Unit 2
- 14 Washington Place
- 14 Washington Place Unit 3
Ask me questions while you tour the home.