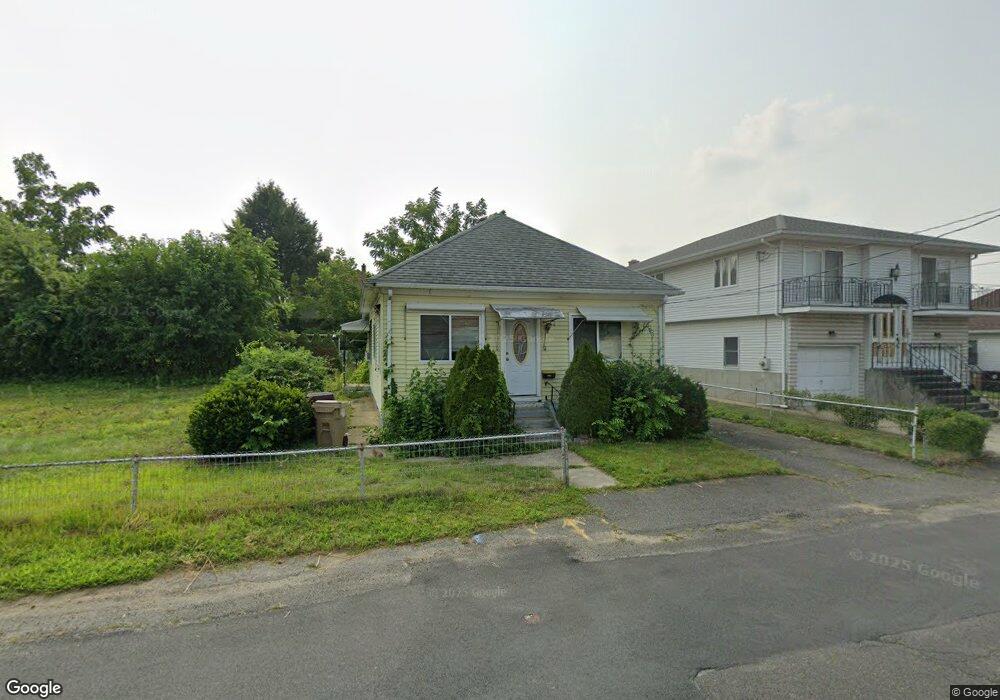
29 Pine St Ludlow, MA 01056
Estimated Value: $264,000 - $300,000
2
Beds
2
Baths
912
Sq Ft
$312/Sq Ft
Est. Value
About This Home
This home is located at 29 Pine St, Ludlow, MA 01056 and is currently estimated at $284,814, approximately $312 per square foot. 29 Pine St is a home located in Hampden County with nearby schools including East Street Elementary School, Chapin Street Elementary School, and Paul R. Baird Middle School.
Ownership History
Date
Name
Owned For
Owner Type
Purchase Details
Closed on
Aug 29, 2019
Sold by
Konieczny-Sharpe Joanne
Bought by
Gorzynski Adam and Gorzynska Iwona
Current Estimated Value
Purchase Details
Closed on
Apr 16, 2008
Sold by
Konieczny Angela C and Konieczny Walter
Bought by
Konieczny Angela C and Konieczny-Sharpe Joanne
Create a Home Valuation Report for This Property
The Home Valuation Report is an in-depth analysis detailing your home's value as well as a comparison with similar homes in the area
Home Values in the Area
Average Home Value in this Area
Purchase History
| Date | Buyer | Sale Price | Title Company |
|---|---|---|---|
| Gorzynski Adam | $100,000 | -- | |
| Gorzynski Adam | $100,000 | -- | |
| Konieczny Angela C | -- | -- | |
| Konieczny Angela C | -- | -- |
Source: Public Records
Mortgage History
| Date | Status | Borrower | Loan Amount |
|---|---|---|---|
| Previous Owner | Konieczny Angela C | $80,000 | |
| Previous Owner | Konieczny Angela C | $15,000 | |
| Previous Owner | Konieczny Angela C | $70,000 |
Source: Public Records
Tax History
| Year | Tax Paid | Tax Assessment Tax Assessment Total Assessment is a certain percentage of the fair market value that is determined by local assessors to be the total taxable value of land and additions on the property. | Land | Improvement |
|---|---|---|---|---|
| 2025 | $3,619 | $208,600 | $74,000 | $134,600 |
| 2024 | $3,486 | $192,700 | $74,000 | $118,700 |
| 2023 | $3,274 | $167,800 | $64,900 | $102,900 |
| 2022 | $3,148 | $157,500 | $64,900 | $92,600 |
| 2021 | $3,181 | $150,900 | $64,900 | $86,000 |
| 2020 | $3,050 | $147,900 | $64,000 | $83,900 |
| 2019 | $2,824 | $142,500 | $63,300 | $79,200 |
| 2018 | $2,659 | $139,900 | $63,300 | $76,600 |
| 2017 | $2,568 | $138,600 | $61,500 | $77,100 |
| 2016 | $2,420 | $133,500 | $60,200 | $73,300 |
| 2015 | $2,274 | $131,500 | $59,600 | $71,900 |
Source: Public Records
Map
Nearby Homes
- 31 Greenwich St
- 101 Ray St
- 38 Prospect St
- 162 Highland Ave
- 37 Franklin St
- 259 Prospect St
- 0 Center St Unit 73415933
- 350 West Ave Unit 5
- 39 Rogers Ave
- 517 Ideal Ln Unit 401
- 517 Ideal Ln Unit 702
- 25 Dale St
- 2205 Boston Rd Unit Q160
- 2205 Boston Rd Unit K100
- 84 Chapin Greene Dr
- 102 Swan Ave
- 98 Fuller St Unit 32
- 24 Dumaine St
- 107 Enfield St
- 70 Sroka Ln
Your Personal Tour Guide
Ask me questions while you tour the home.