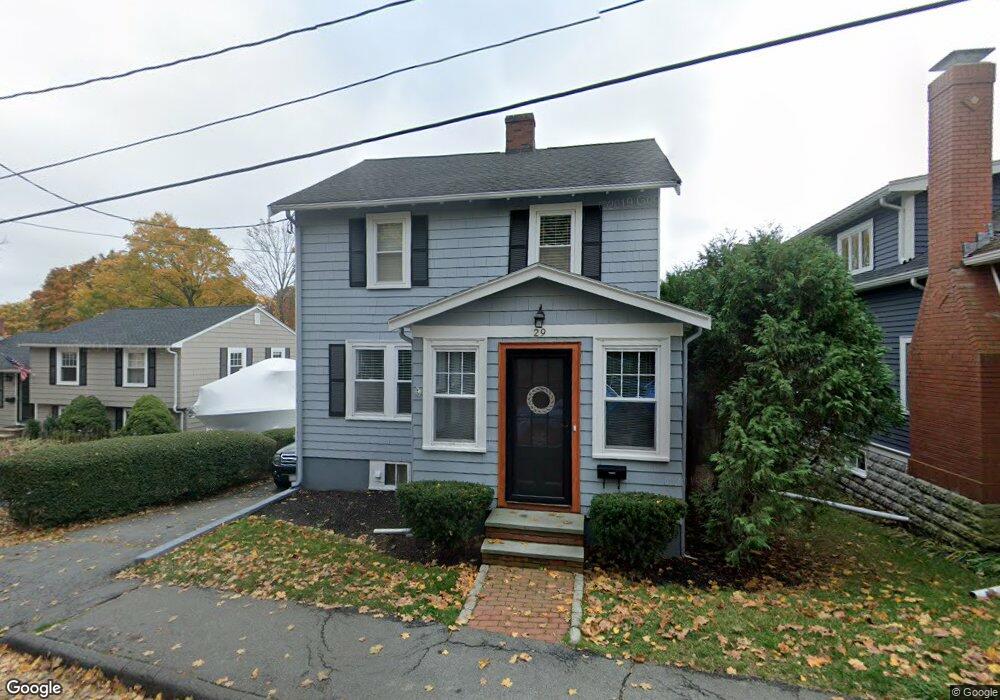
29 Shepard St Marblehead, MA 01945
Estimated Value: $753,000 - $860,000
3
Beds
1
Bath
1,248
Sq Ft
$632/Sq Ft
Est. Value
About This Home
This home is located at 29 Shepard St, Marblehead, MA 01945 and is currently estimated at $789,222, approximately $632 per square foot. 29 Shepard St is a home located in Essex County with nearby schools including Marblehead High School, Marblehead Community Charter Public School, and Tower School.
Ownership History
Date
Name
Owned For
Owner Type
Purchase Details
Closed on
Oct 30, 1998
Sold by
Smith Richard H and Smith Jennifer
Bought by
Locke Brendan M
Current Estimated Value
Purchase Details
Closed on
Feb 16, 1993
Sold by
Prescott Jennie M and Briggs Warren
Bought by
Smith Richard H
Create a Home Valuation Report for This Property
The Home Valuation Report is an in-depth analysis detailing your home's value as well as a comparison with similar homes in the area
Home Values in the Area
Average Home Value in this Area
Purchase History
| Date | Buyer | Sale Price | Title Company |
|---|---|---|---|
| Locke Brendan M | $229,900 | -- | |
| Locke Brendan M | $229,900 | -- | |
| Smith Richard H | $150,500 | -- | |
| Smith Richard H | $150,500 | -- |
Source: Public Records
Mortgage History
| Date | Status | Borrower | Loan Amount |
|---|---|---|---|
| Open | Smith Richard H | $318,000 | |
| Closed | Smith Richard H | $325,000 |
Source: Public Records
Tax History
| Year | Tax Paid | Tax Assessment Tax Assessment Total Assessment is a certain percentage of the fair market value that is determined by local assessors to be the total taxable value of land and additions on the property. | Land | Improvement |
|---|---|---|---|---|
| 2025 | $6,446 | $712,300 | $514,200 | $198,100 |
| 2024 | $6,146 | $685,900 | $491,300 | $194,600 |
| 2023 | $6,300 | $630,000 | $468,500 | $161,500 |
| 2022 | $5,678 | $539,700 | $382,800 | $156,900 |
| 2021 | $5,432 | $521,300 | $365,600 | $155,700 |
| 2020 | $5,249 | $505,200 | $365,600 | $139,600 |
| 2019 | $5,059 | $471,000 | $331,400 | $139,600 |
| 2018 | $4,938 | $448,100 | $308,500 | $139,600 |
| 2017 | $4,556 | $413,800 | $274,200 | $139,600 |
| 2016 | $4,467 | $402,400 | $262,800 | $139,600 |
| 2015 | $4,332 | $391,000 | $251,400 | $139,600 |
| 2014 | $3,917 | $353,200 | $217,100 | $136,100 |
Source: Public Records
Map
Nearby Homes
- 55 Roosevelt Ave
- 63 Green St
- 9 Lincoln Park
- 27 Evans Rd
- 78 Bayview Rd
- 145 Evans Road Extension
- 1 Knollwood Rd
- 6 Mount Vernon St
- 197A W Shore Dr Unit A
- 8 Linden St
- 13 Linden St Unit 2
- 157 Green St Unit 3
- 132 Elm St
- 132 Elm St Unit 132
- 2 Highland Terrace
- 16 Liberty Rd
- 72 Village St
- 1 Haley Rd
- 27 Village St Unit 1
- 69 Kenneth Rd
Your Personal Tour Guide
Ask me questions while you tour the home.