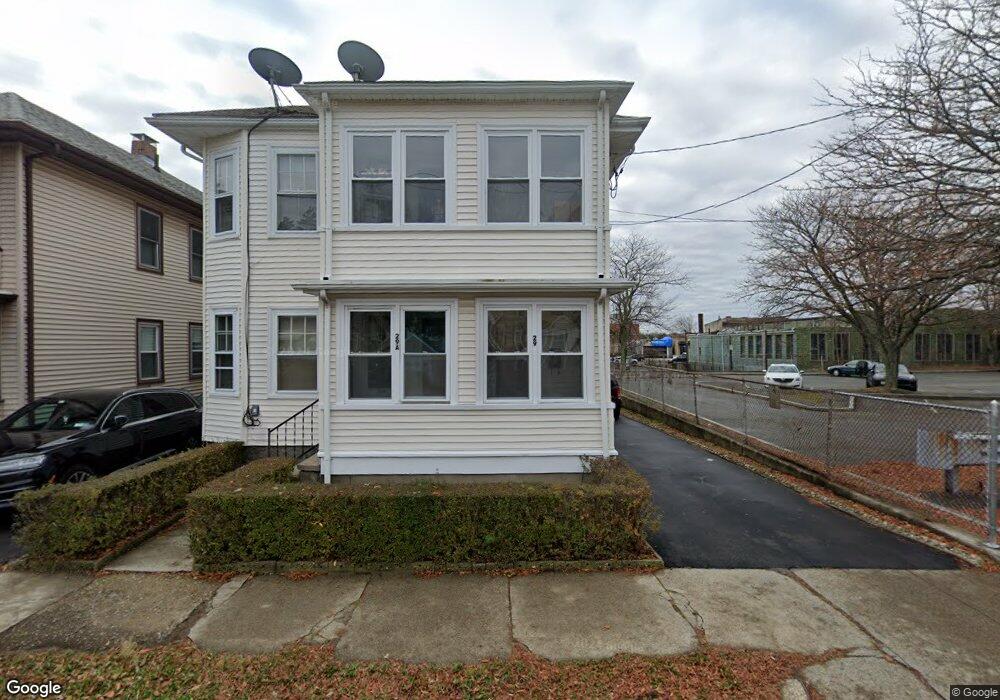
29 Vane St Quincy, MA 02171
North Quincy NeighborhoodEstimated Value: $780,045 - $1,035,000
4
Beds
2
Baths
2,052
Sq Ft
$439/Sq Ft
Est. Value
About This Home
This home is located at 29 Vane St, Quincy, MA 02171 and is currently estimated at $900,261, approximately $438 per square foot. 29 Vane St is a home located in Norfolk County with nearby schools including Francis W. Parker Elementary School, Atlantic Middle School, and North Quincy High School.
Ownership History
Date
Name
Owned For
Owner Type
Purchase Details
Closed on
Oct 1, 1996
Sold by
Coffey Michael and Coffey Bridget M
Bought by
Thai Suong N and Thai Lan N
Current Estimated Value
Home Financials for this Owner
Home Financials are based on the most recent Mortgage that was taken out on this home.
Original Mortgage
$135,200
Outstanding Balance
$12,128
Interest Rate
7.83%
Mortgage Type
Purchase Money Mortgage
Estimated Equity
$888,133
Create a Home Valuation Report for This Property
The Home Valuation Report is an in-depth analysis detailing your home's value as well as a comparison with similar homes in the area
Home Values in the Area
Average Home Value in this Area
Purchase History
| Date | Buyer | Sale Price | Title Company |
|---|---|---|---|
| Thai Suong N | $169,900 | -- |
Source: Public Records
Mortgage History
| Date | Status | Borrower | Loan Amount |
|---|---|---|---|
| Open | Thai Suong N | $135,200 |
Source: Public Records
Tax History
| Year | Tax Paid | Tax Assessment Tax Assessment Total Assessment is a certain percentage of the fair market value that is determined by local assessors to be the total taxable value of land and additions on the property. | Land | Improvement |
|---|---|---|---|---|
| 2025 | $8,727 | $756,900 | $345,000 | $411,900 |
| 2024 | $8,389 | $744,400 | $345,000 | $399,400 |
| 2023 | $7,799 | $700,700 | $313,700 | $387,000 |
| 2022 | $7,316 | $610,700 | $251,000 | $359,700 |
| 2021 | $7,439 | $612,800 | $251,000 | $361,800 |
| 2020 | $7,509 | $604,100 | $246,000 | $358,100 |
| 2019 | $7,216 | $575,000 | $236,500 | $338,500 |
| 2018 | $6,873 | $515,200 | $225,300 | $289,900 |
| 2017 | $6,790 | $479,200 | $204,800 | $274,400 |
| 2016 | $6,133 | $427,100 | $186,200 | $240,900 |
| 2015 | $5,804 | $397,500 | $169,300 | $228,200 |
| 2014 | $5,186 | $349,000 | $169,300 | $179,700 |
Source: Public Records
Map
Nearby Homes
- 17 Holmes St Unit 2
- 20 Ellington Rd
- 98 Safford St
- 54 Safford St
- 85 E Squantum St Unit 10
- 4 Edwin St
- 115 W Squantum St Unit 816
- 115 W Squantum St Unit 607
- 115 W Squantum St Unit 517
- 115 W Squantum St Unit 203
- 27 Warwick St
- 11 Gould St
- 135 E Squantum St
- 267-269 Farrington St
- 153 Vassall St
- 27 Herbert Rd
- 113 Elm Ave
- 19 Bass St
- 138 Sherman St
- 134 Sherman St
- 31 Vane St
- 33 Vane St Unit 1
- 33 Vane St
- 35 Vane St
- 35 Vane St Unit 2nd Floor
- 35 Vane St Unit 1st Floor
- 37 Vane St Unit 1st Floor
- 39 Vane St
- 39 Vane St Unit 1,41
- 41 Vane St Unit 1
- 28 Vane St
- 22 Vane St
- 22 Vane St Unit 1
- 22 Vane St Unit 3
- 24 Vane St Unit 1
- 22 Vane St Unit 2
- 32 Vane St
- 440 Hancock St Unit 8
- 440 Hancock St Unit 6
- 440 Hancock St Unit 7-8
Your Personal Tour Guide
Ask me questions while you tour the home.