Estimated Value: $203,000 - $439,000
About This Home
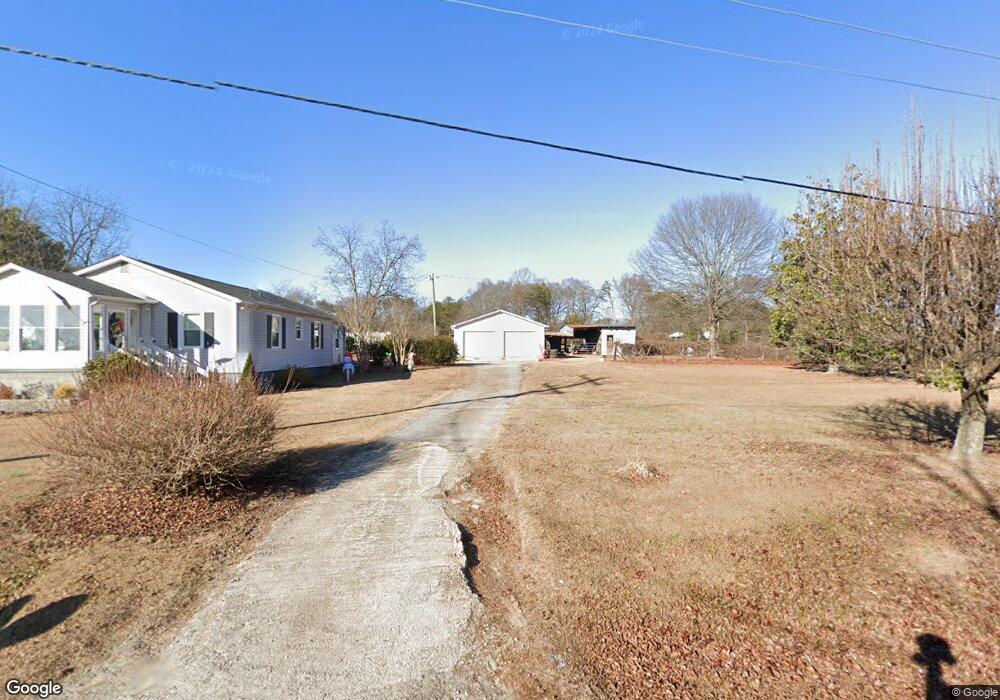
This home is located at 290 Ballenger Rd, Inman, SC 29349 and is currently estimated at $316,544, approximately $254 per square foot. 290 Ballenger Rd is a home located in Spartanburg County with nearby schools including Inman Elementary School, T.E. Mabry Middle School, and Chapman High School.
Ownership History
We collect this data history from publicly available records. To have your information removed, we recommend requesting removal directly through your county’s website.
Purchase Details
Home Financials for this Owner
Home Financials are based on the most recent Mortgage that was taken out on this home.Purchase Details
Home Financials for this Owner
Home Financials are based on the most recent Mortgage that was taken out on this home.Home Values in the Area
Average Home Value in this Area
Purchase History
We collect this data history from publicly available records. To have your information removed, we recommend requesting removal directly through your county’s website.
| Date | Buyer | Sale Price | Title Company |
|---|---|---|---|
| $87,500 | None Available | ||
| -- | -- |
Mortgage History
We collect this data history from publicly available records. To have your information removed, we recommend requesting removal directly through your county’s website.
| Date | Status | Borrower | Loan Amount |
|---|---|---|---|
| Open | $85,914 |
Tax History
We collect this data history from publicly available records. To have your information removed, we recommend requesting removal directly through your county’s website.
| Year | Tax Paid | Tax Assessment Tax Assessment Total Assessment is a certain percentage of the fair market value that is determined by local assessors to be the total taxable value of land and additions on the property. | Land | Improvement |
|---|---|---|---|---|
| 2025 | $863 | $4,531 | $874 | $3,657 |
| 2023 | $863 | $4,531 | $874 | $3,657 |
| 2022 | $782 | $3,945 | $729 | $3,216 |
| 2021 | $782 | $3,945 | $729 | $3,216 |
| 2020 | $788 | $4,075 | $859 | $3,216 |
| 2019 | $788 | $4,075 | $859 | $3,216 |
| 2018 | $849 | $4,457 | $1,360 | $3,097 |
| 2017 | $755 | $3,876 | $1,080 | $2,796 |
| 2016 | $755 | $3,876 | $1,080 | $2,796 |
| 2015 | $2,421 | $10,806 | $6,612 | $4,194 |
| 2014 | $167 | $2,634 | $394 | $2,240 |
Map
- 304 Bellrock Rd
- 322 Bellrock Rd
- 310 Bellrock Rd
- 309 Bellrock Rd
- 314 Bellrock Rd
- 326 Bellrock Rd
- 321 Bellrock Rd
- 325 Bellrock Rd
- 333 Bellrock Rd
- 341 Bellrock Rd
- 318 Bellrock Rd
- 349 Bellrock Rd
- 160 Inn View Dr
- 184 Woodland Ave
- 310 Holly Springs Rd
- 19 3rd St
- 221 N Main St
- 119 Beechwood Dr
- 2 3rd St
- 1 F St
Ask me questions while you tour the home.