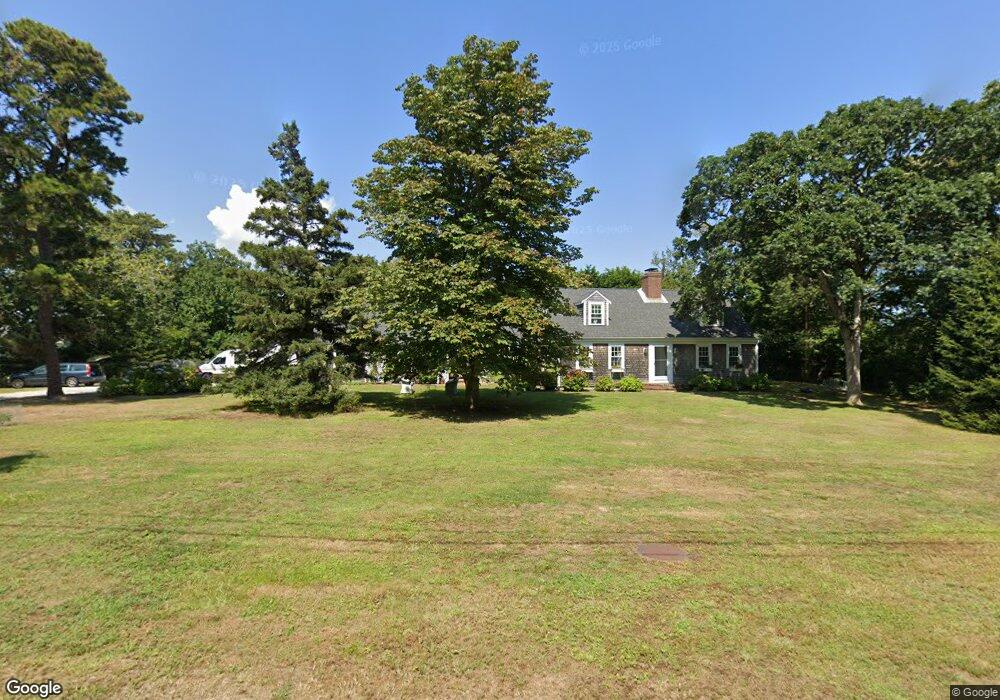
290 Champlain Rd Chatham, MA 02633
Chatham Village NeighborhoodEstimated Value: $2,103,000 - $3,050,000
3
Beds
3
Baths
2,116
Sq Ft
$1,183/Sq Ft
Est. Value
About This Home
This home is located at 290 Champlain Rd, Chatham, MA 02633 and is currently estimated at $2,503,665, approximately $1,183 per square foot. 290 Champlain Rd is a home located in Barnstable County with nearby schools including Chatham Elementary School, Harwich Elementary School, and Monomoy Regional Middle School.
Ownership History
Date
Name
Owned For
Owner Type
Purchase Details
Closed on
Aug 21, 2020
Sold by
Hall-Ramos Allison
Bought by
Hall-Ramos Allison and Ramos Edwin
Current Estimated Value
Purchase Details
Closed on
Jun 23, 2020
Sold by
Hall Peter E
Bought by
Hall-Ramos Allison
Purchase Details
Closed on
May 29, 1998
Sold by
Jones Francis B and Jones Jean
Bought by
Hall Peter E and Hall Maryann
Create a Home Valuation Report for This Property
The Home Valuation Report is an in-depth analysis detailing your home's value as well as a comparison with similar homes in the area
Home Values in the Area
Average Home Value in this Area
Purchase History
| Date | Buyer | Sale Price | Title Company |
|---|---|---|---|
| Hall-Ramos Allison | -- | None Available | |
| Hall-Ramos Allison | -- | None Available | |
| Hall Peter E | $348,750 | -- |
Source: Public Records
Tax History
| Year | Tax Paid | Tax Assessment Tax Assessment Total Assessment is a certain percentage of the fair market value that is determined by local assessors to be the total taxable value of land and additions on the property. | Land | Improvement |
|---|---|---|---|---|
| 2025 | $7,091 | $2,043,600 | $1,457,900 | $585,700 |
| 2024 | $6,885 | $1,928,500 | $1,375,500 | $553,000 |
| 2023 | $6,400 | $1,649,400 | $1,146,100 | $503,300 |
| 2022 | $6,906 | $1,494,900 | $1,146,100 | $348,800 |
| 2021 | $7,347 | $1,475,400 | $1,172,000 | $303,400 |
| 2020 | $7,108 | $1,474,700 | $1,172,000 | $302,700 |
| 2019 | $6,782 | $1,398,300 | $1,095,600 | $302,700 |
| 2018 | $7,049 | $1,447,400 | $1,168,700 | $278,700 |
| 2017 | $7,068 | $1,405,100 | $1,134,400 | $270,700 |
| 2016 | $6,917 | $1,377,800 | $1,112,300 | $265,500 |
| 2015 | $5,517 | $1,105,600 | $844,300 | $261,300 |
| 2014 | $5,597 | $1,101,800 | $844,300 | $257,500 |
Source: Public Records
Map
Nearby Homes
- 15 Windy Hill Way
- 287 Cedar St
- 85 Cedar St
- 246 Stage Island Rd
- 99 Uncle Alberts Drive Extension
- 14 Pond View Ln
- 346 Morris Island Rd
- 55 Christopher Harding Ln
- 8 Kingsbury Way
- 3 Oyster Dr
- 20 Jessies Landing
- 22 Starfish Ln Unit 22
- 169 Tisquantum Rd
- 33 Crowell Rd
- 101 Morris Island Rd
- 425 Main St Unit D
- 425 Main St Unit D
- 1 Seastrand Way Unit 1
- 912 Main St Unit 308
- 92 Indian Trail
- 38 Monomoy Cir
- 28 Monomoy Cir
- 244 Champlain Rd
- 37 Monomoy Cir
- 330 Champlain Rd
- 25 Monomoy Cir
- 0 Monomoy Cir
- 0 Sears Rd
- 1 Sears Rd
- 7 Battlefield Rd
- 4 Battlefield Rd
- 0 Battlefield Rd
- 13 Monomoy Cir
- 25 Battlefield Rd
- 29 Battlefield Rd
- 75 Battlefield Rd
- 211 Champlain Rd
- 64 Battlefield Rd
- 275 Champlain Rd
- 16 Sears Rd
Your Personal Tour Guide
Ask me questions while you tour the home.