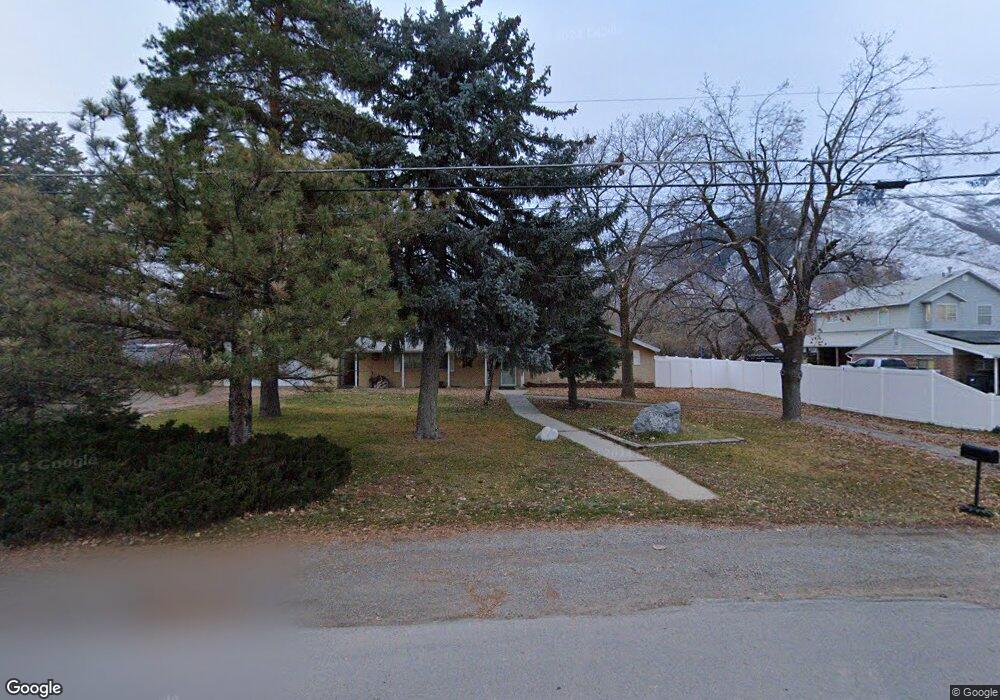
290 N Main St Mapleton, UT 84664
Estimated Value: $667,000 - $717,000
3
Beds
2
Baths
1,790
Sq Ft
$387/Sq Ft
Est. Value
About This Home
This home is located at 290 N Main St, Mapleton, UT 84664 and is currently estimated at $692,875, approximately $387 per square foot. 290 N Main St is a home located in Utah County with nearby schools including Mapleton School, Mapleton Junior High School, and Maple Mountain High School.
Ownership History
Date
Name
Owned For
Owner Type
Purchase Details
Closed on
Sep 1, 2021
Sold by
Bird Korry R and Bird Diane R
Bought by
Bird Family Holdings Llc
Current Estimated Value
Purchase Details
Closed on
Jul 27, 2011
Sold by
King Kaye L and King Kenzie W
Bought by
Westmoreland Shane
Home Financials for this Owner
Home Financials are based on the most recent Mortgage that was taken out on this home.
Original Mortgage
$45,000
Outstanding Balance
$37,677
Interest Rate
10%
Mortgage Type
Seller Take Back
Estimated Equity
$655,198
Create a Home Valuation Report for This Property
The Home Valuation Report is an in-depth analysis detailing your home's value as well as a comparison with similar homes in the area
Home Values in the Area
Average Home Value in this Area
Purchase History
| Date | Buyer | Sale Price | Title Company |
|---|---|---|---|
| Bird Family Holdings Llc | -- | Pro Title And Escrow Inc | |
| Westmoreland Shane | -- | Cottonwood Title Insurance A |
Source: Public Records
Mortgage History
| Date | Status | Borrower | Loan Amount |
|---|---|---|---|
| Open | Westmoreland Shane | $45,000 |
Source: Public Records
Tax History
| Year | Tax Paid | Tax Assessment Tax Assessment Total Assessment is a certain percentage of the fair market value that is determined by local assessors to be the total taxable value of land and additions on the property. | Land | Improvement |
|---|---|---|---|---|
| 2025 | $2,917 | $305,415 | -- | -- |
| 2024 | $2,917 | $285,780 | $0 | $0 |
| 2023 | $2,990 | $294,800 | $0 | $0 |
| 2022 | $3,022 | $294,525 | $0 | $0 |
| 2021 | $2,407 | $360,200 | $224,200 | $136,000 |
| 2020 | $2,310 | $334,400 | $198,400 | $136,000 |
| 2019 | $2,089 | $308,700 | $190,400 | $118,300 |
| 2018 | $1,841 | $258,900 | $160,300 | $98,600 |
| 2017 | $1,739 | $129,800 | $0 | $0 |
| 2016 | $1,592 | $118,140 | $0 | $0 |
| 2015 | $1,490 | $109,890 | $0 | $0 |
| 2014 | $1,454 | $105,325 | $0 | $0 |
Source: Public Records
Map
Nearby Homes
- 84 E 530 N
- 265 E 600 N
- 415 E Maple St
- 141 N 600 E
- 897 N Main St
- 572 W 500 N
- 648 W 400 N
- 667 N 550 W
- 754 W 400 N Unit 29
- 745 E Maple St
- 126 N 800 W
- 310 N 800 E
- 435 E 1000 N
- 162 N 800 E
- 594 E 1000 N
- 4664 S 680 W Unit S204
- 4664 S 680 W Unit S203
- 4664 S 680 W Unit S302
- 4664 S 680 W Unit S303
- 4664 S 680 W Unit S201
Your Personal Tour Guide
Ask me questions while you tour the home.