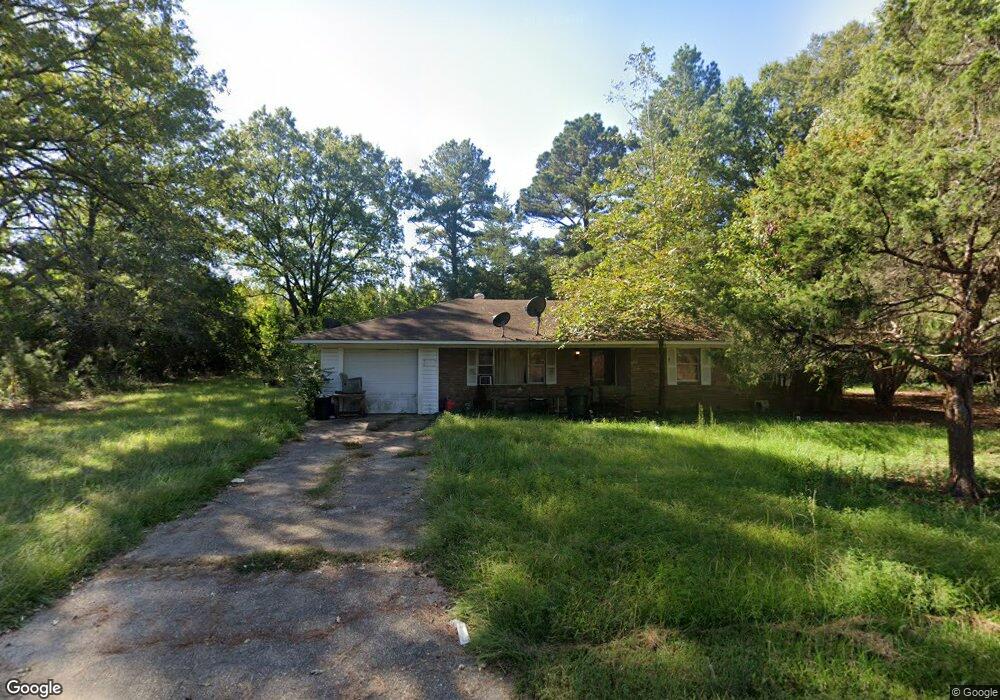
291 Binns Loop Crossett, AR 71635
Estimated Value: $106,608 - $166,000
About This Home
This home is located at 291 Binns Loop, Crossett, AR 71635 and is currently estimated at $137,152, approximately $93 per square foot. 291 Binns Loop is a home located in Ashley County with nearby schools including Crossett Elementary School, Crossett Middle School, and Crossett High School.
Ownership History
We collect this data history from publicly available records. To have your information removed, we recommend requesting removal directly through your county’s website.
Purchase Details
Purchase Details
Purchase Details
Purchase Details
Purchase Details
Purchase Details
Purchase Details
Purchase Details
Purchase Details
Home Values in the Area
Average Home Value in this Area
Purchase History
We collect this data history from publicly available records. To have your information removed, we recommend requesting removal directly through your county’s website.
| Date | Buyer | Sale Price | Title Company |
|---|---|---|---|
| $3,810 | None Listed On Document | ||
| -- | -- | ||
| $1,000 | -- | ||
| -- | -- | ||
| -- | -- | ||
| -- | -- | ||
| -- | -- | ||
| -- | -- | ||
| -- | -- |
Tax History
We collect this data history from publicly available records. To have your information removed, we recommend requesting removal directly through your county’s website.
| Year | Tax Paid | Tax Assessment Tax Assessment Total Assessment is a certain percentage of the fair market value that is determined by local assessors to be the total taxable value of land and additions on the property. | Land | Improvement |
|---|---|---|---|---|
| 2025 | $86 | $20,130 | $5,180 | $14,950 |
| 2024 | $186 | $20,130 | $5,180 | $14,950 |
| 2023 | $261 | $20,130 | $5,180 | $14,950 |
| 2022 | $445 | $14,510 | $3,590 | $10,920 |
| 2021 | $481 | $14,510 | $3,590 | $10,920 |
| 2020 | $481 | $14,510 | $3,590 | $10,920 |
| 2019 | $481 | $14,510 | $3,590 | $10,920 |
| 2018 | $856 | $14,510 | $3,590 | $10,920 |
| 2017 | $658 | $13,910 | $2,990 | $10,920 |
| 2016 | $602 | $13,910 | $2,990 | $10,920 |
| 2015 | $602 | $13,910 | $2,990 | $10,920 |
| 2014 | $602 | $13,910 | $2,990 | $10,920 |
Map
- 108 Homestead Ave
- 1492 Highway 52 W
- 0 Binns Loop Unit 26018013
- 293 Ashley 491 Rd
- 150 Marias Saline Rd
- 1428 James St
- 0 Ashley Rd Unit 25018760
- 1436 Mimosa St
- 241 Etheridge Dr
- 1429 Mimosa St
- 0 Ashley Road 20
- 000 Fairview Rd Hwy 133 N
- 0 Ashley 461
- 145 Unity Ln
- 15-15-8 Arkansas 133
- 407 Cedar St
- 404 Cedar St
- 402 Elm St
- 702 Pecan St
- 622 N Sivils St
Ask me questions while you tour the home.