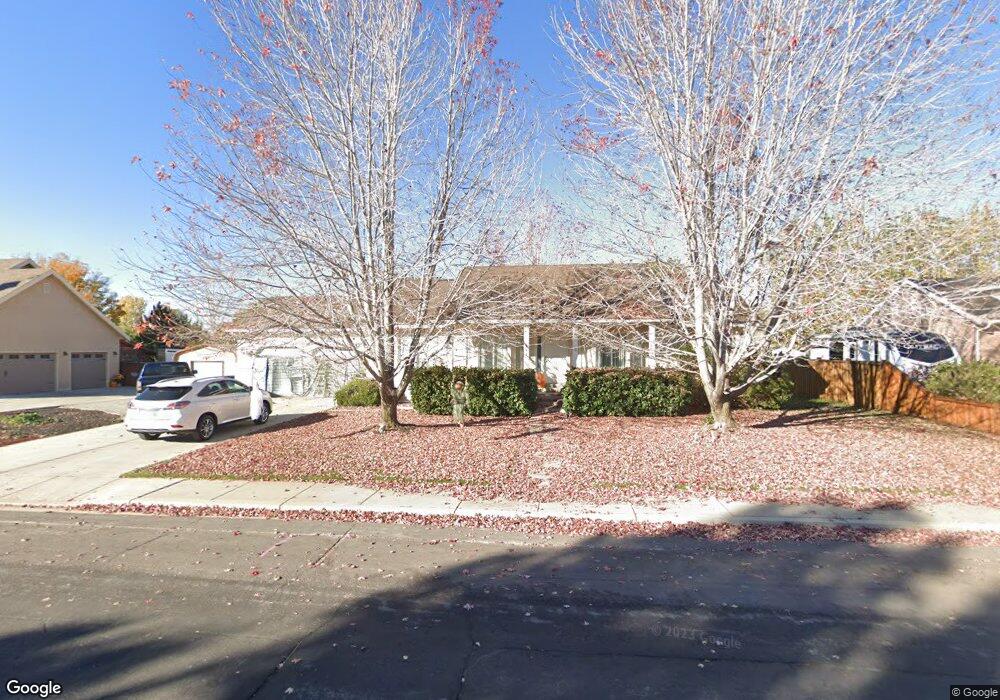
291 N 400 E Mapleton, UT 84664
Estimated Value: $639,000 - $653,000
4
Beds
3
Baths
1,691
Sq Ft
$382/Sq Ft
Est. Value
About This Home
This home is located at 291 N 400 E, Mapleton, UT 84664 and is currently estimated at $646,132, approximately $382 per square foot. 291 N 400 E is a home located in Utah County with nearby schools including Mapleton School, Mapleton Junior High School, and Maple Mountain High School.
Ownership History
Date
Name
Owned For
Owner Type
Purchase Details
Closed on
Apr 17, 2024
Sold by
Reynolds Gary R
Bought by
Gary Ross Reynolds Revocable Trust and Reynolds
Current Estimated Value
Purchase Details
Closed on
Apr 16, 1999
Sold by
Moon Lamar F
Bought by
Reynolds Gary R and Reynolds Evelyn M
Home Financials for this Owner
Home Financials are based on the most recent Mortgage that was taken out on this home.
Original Mortgage
$120,000
Interest Rate
7.04%
Purchase Details
Closed on
Oct 20, 1998
Sold by
Ainge Craig B and Ainge Kathy B
Bought by
Moon Lamar F
Create a Home Valuation Report for This Property
The Home Valuation Report is an in-depth analysis detailing your home's value as well as a comparison with similar homes in the area
Home Values in the Area
Average Home Value in this Area
Purchase History
| Date | Buyer | Sale Price | Title Company |
|---|---|---|---|
| Gary Ross Reynolds Revocable Trust | -- | None Listed On Document | |
| Reynolds Gary R | -- | Backman Stewart Title | |
| Moon Lamar F | -- | -- |
Source: Public Records
Mortgage History
| Date | Status | Borrower | Loan Amount |
|---|---|---|---|
| Previous Owner | Reynolds Gary R | $120,000 |
Source: Public Records
Tax History
| Year | Tax Paid | Tax Assessment Tax Assessment Total Assessment is a certain percentage of the fair market value that is determined by local assessors to be the total taxable value of land and additions on the property. | Land | Improvement |
|---|---|---|---|---|
| 2025 | $2,984 | $317,405 | -- | -- |
| 2024 | $2,984 | $292,325 | $0 | $0 |
| 2023 | $3,079 | $303,545 | $0 | $0 |
| 2022 | $3,499 | $341,055 | $0 | $0 |
| 2021 | $2,939 | $439,900 | $160,900 | $279,000 |
| 2020 | $2,911 | $421,400 | $142,400 | $279,000 |
| 2019 | $2,566 | $379,200 | $136,600 | $242,600 |
| 2018 | $2,318 | $326,100 | $115,000 | $211,100 |
| 2017 | $2,148 | $160,325 | $0 | $0 |
| 2016 | $2,088 | $154,935 | $0 | $0 |
| 2015 | $1,951 | $143,880 | $0 | $0 |
| 2014 | -- | $129,580 | $0 | $0 |
Source: Public Records
Map
Nearby Homes
Your Personal Tour Guide
Ask me questions while you tour the home.