2915 Olive St Columbus, OH 43204
Westgate NeighborhoodEstimated Value: $141,000 - $228,000
About This Home
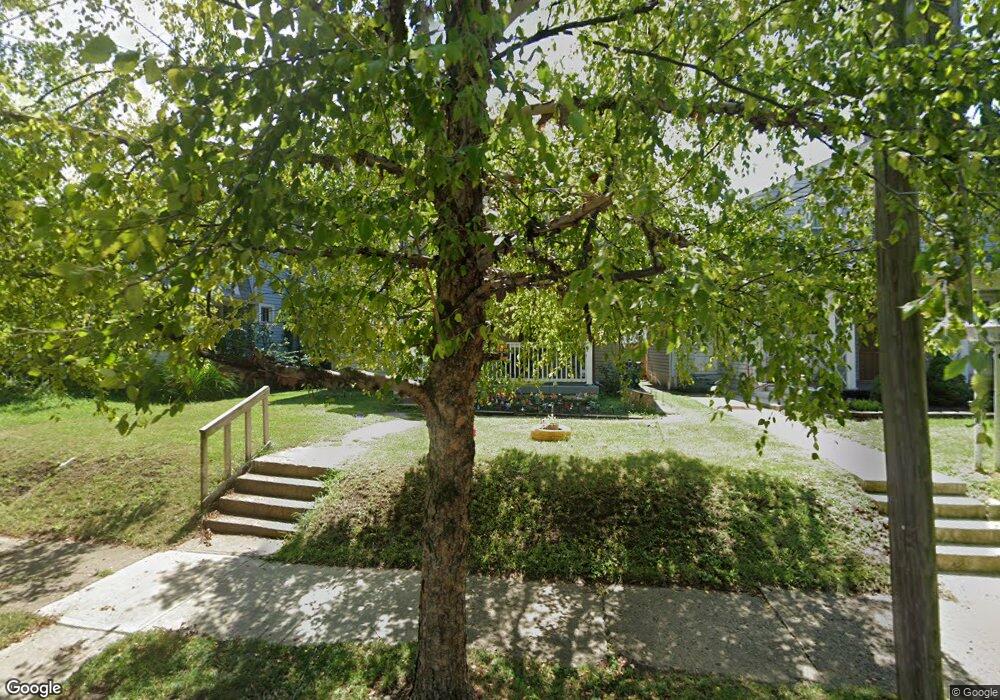
This home is located at 2915 Olive St, Columbus, OH 43204 and is currently estimated at $192,000, approximately $117 per square foot. 2915 Olive St is a home located in Franklin County with nearby schools including Westgate Alternative Elementary School, Westmoor Middle School, and West High School.
Ownership History
We collect this data history from publicly available records. To have your information removed, we recommend requesting removal directly through your county’s website.
Purchase Details
Purchase Details
Purchase Details
Purchase Details
Home Values in the Area
Average Home Value in this Area
Purchase History
We collect this data history from publicly available records. To have your information removed, we recommend requesting removal directly through your county’s website.
| Date | Buyer | Sale Price | Title Company |
|---|---|---|---|
| -- | Bridge T&E Svcs Llc | ||
| $56,200 | Amerititle | ||
| $80,000 | -- | ||
| -- | -- |
Tax History
We collect this data history from publicly available records. To have your information removed, we recommend requesting removal directly through your county’s website.
| Year | Tax Paid | Tax Assessment Tax Assessment Total Assessment is a certain percentage of the fair market value that is determined by local assessors to be the total taxable value of land and additions on the property. | Land | Improvement |
|---|---|---|---|---|
| 2025 | $1,930 | $42,110 | $18,200 | $23,910 |
| 2024 | $1,930 | $42,110 | $18,200 | $23,910 |
| 2023 | $1,906 | $42,110 | $18,200 | $23,910 |
| 2022 | $1,696 | $31,920 | $5,810 | $26,110 |
| 2021 | $1,699 | $31,920 | $5,810 | $26,110 |
| 2020 | $1,702 | $31,920 | $5,810 | $26,110 |
| 2019 | $1,655 | $26,610 | $4,870 | $21,740 |
| 2018 | $1,302 | $26,610 | $4,870 | $21,740 |
| 2017 | $1,704 | $26,610 | $4,870 | $21,740 |
| 2016 | $1,361 | $16,450 | $7,840 | $8,610 |
| 2015 | $1,017 | $16,450 | $7,840 | $8,610 |
| 2014 | $1,020 | $16,450 | $7,840 | $8,610 |
| 2013 | $503 | $16,450 | $7,840 | $8,610 |
Map
- 190 S Roys Ave
- 85 S Powell Ave
- 181 S Huron Ave
- 49 S Westmoor Ave
- 65 S Hague Ave
- 219 S Westmoor Ave
- 182 S Hague Ave
- 227 S Hague Ave
- 259 S Hague Ave
- 99 S Brinker Ave
- 42 N Westgate Ave
- 110 N Chase Ave
- 2710 Palmetto St
- 107 N Powell Ave
- 228 N Harris Ave
- 73-75 S Warren Ave
- 113 N Powell Ave
- 363 S Chase Ave
- 140 N Warren Ave
- 70 N Warren Ave
- 2930 Olive St
- 2936 Olive St
- 2936 Olive St Unit Sr
- 2924 Olive St
- 2920 Olive St
- 2942 Olive St
- 2916 Olive St
- 2925 Olive St
- 2921 Olive St
- 2946 Olive St
- 2935 Crescent Dr
- 2941 Crescent Dr
- 2911 Olive St
- 130 Guernsey Ave
- 2929 Crescent Dr
- 105 S Roys Ave
- 2949 Crescent Dr
- 2905 Olive St
- 97 S Roys Ave
- 2923 Crescent Dr
Ask me questions while you tour the home.