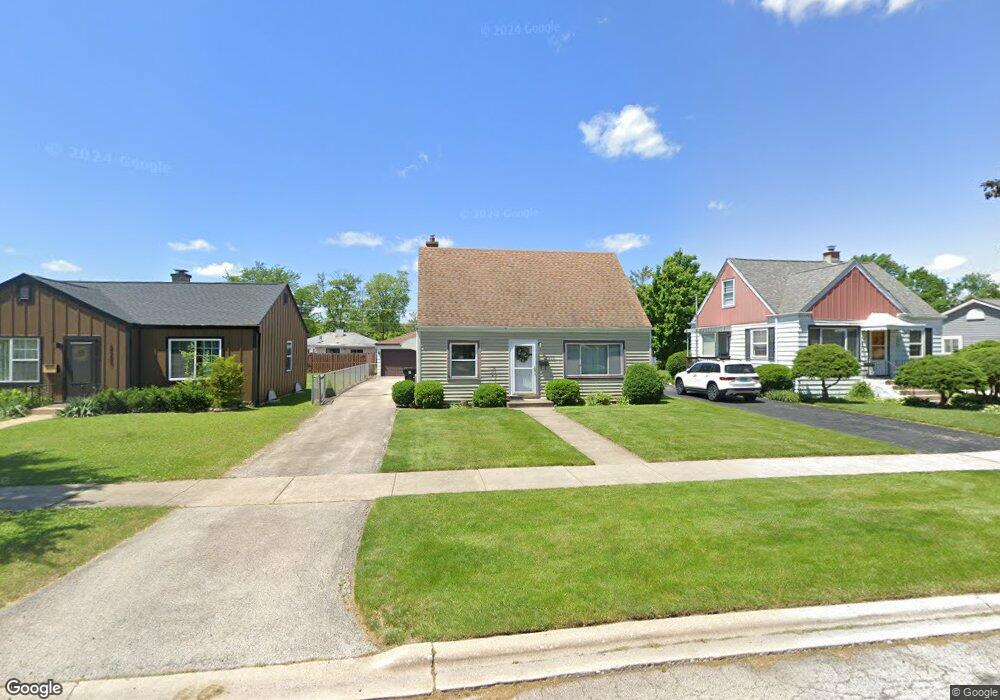
2916 S 12th Ave Broadview, IL 60155
Estimated Value: $285,223 - $302,000
3
Beds
2
Baths
1,100
Sq Ft
$269/Sq Ft
Est. Value
About This Home
This home is located at 2916 S 12th Ave, Broadview, IL 60155 and is currently estimated at $296,306, approximately $269 per square foot. 2916 S 12th Ave is a home located in Cook County with nearby schools including Komarek Elementary School, Proviso East High School, and Westchester Christian School.
Ownership History
Date
Name
Owned For
Owner Type
Purchase Details
Closed on
Jul 27, 2005
Sold by
Siekmann Mark J and Siekmann Lori C
Bought by
Buerger Jane
Current Estimated Value
Home Financials for this Owner
Home Financials are based on the most recent Mortgage that was taken out on this home.
Original Mortgage
$185,310
Outstanding Balance
$95,876
Interest Rate
5.82%
Mortgage Type
New Conventional
Estimated Equity
$200,430
Purchase Details
Closed on
Apr 12, 2001
Sold by
Eugling Carla M
Bought by
Siekmann Mark J and Siekmann Lori C
Home Financials for this Owner
Home Financials are based on the most recent Mortgage that was taken out on this home.
Original Mortgage
$134,900
Interest Rate
7.05%
Purchase Details
Closed on
Feb 27, 1997
Sold by
Hall Verbin R and Hall Teri J
Bought by
Eugling Carla M and Eugling Matilda A
Home Financials for this Owner
Home Financials are based on the most recent Mortgage that was taken out on this home.
Original Mortgage
$117,894
Interest Rate
7.93%
Mortgage Type
FHA
Create a Home Valuation Report for This Property
The Home Valuation Report is an in-depth analysis detailing your home's value as well as a comparison with similar homes in the area
Home Values in the Area
Average Home Value in this Area
Purchase History
We collect this data history from publicly available records. To have your information removed, we recommend requesting removal directly through your county’s website.
| Date | Buyer | Sale Price | Title Company |
|---|---|---|---|
| Buerger Jane | $206,000 | Chicago Title Insurance Comp | |
| Siekmann Mark J | $142,000 | Chicago Title Insurance Co | |
| Eugling Carla M | $119,000 | -- |
Source: Public Records
Mortgage History
We collect this data history from publicly available records. To have your information removed, we recommend requesting removal directly through your county’s website.
| Date | Status | Borrower | Loan Amount |
|---|---|---|---|
| Open | Buerger Jane | $185,310 | |
| Previous Owner | Siekmann Mark J | $134,900 | |
| Previous Owner | Eugling Carla M | $117,894 |
Source: Public Records
Tax History
| Year | Tax Paid | Tax Assessment Tax Assessment Total Assessment is a certain percentage of the fair market value that is determined by local assessors to be the total taxable value of land and additions on the property. | Land | Improvement |
|---|---|---|---|---|
| 2025 | $5,985 | $20,001 | $3,438 | $16,563 |
| 2024 | $5,985 | $20,001 | $3,438 | $16,563 |
| 2023 | $6,320 | $20,001 | $3,438 | $16,563 |
| 2022 | $6,320 | $17,329 | $2,500 | $14,829 |
| 2021 | $6,062 | $17,328 | $2,500 | $14,828 |
| 2020 | $5,935 | $17,328 | $2,500 | $14,828 |
| 2019 | $4,512 | $13,221 | $2,343 | $10,878 |
| 2018 | $4,381 | $13,221 | $2,343 | $10,878 |
| 2017 | $4,335 | $13,221 | $2,343 | $10,878 |
| 2016 | $3,876 | $11,156 | $2,187 | $8,969 |
| 2015 | $3,846 | $11,156 | $2,187 | $8,969 |
| 2014 | $3,767 | $11,156 | $2,187 | $8,969 |
| 2013 | $3,959 | $12,573 | $2,187 | $10,386 |
Source: Public Records
Map
Nearby Homes
- 2233 S 14th Ave
- 2263 S 14th Ave
- 2253 S 15th Ave
- 2263 S 17th Ave
- 2310 S 17th Ave
- 9020 W Forestview Dr
- 2322 S 17th Ave Unit 5
- 2509 S 10th Ave
- 9135 26th Place
- 2536 S 5th Ave
- 2357 S 3rd Ave
- 9101 27th St
- 2711 Maple Ave
- 2316 S 10th Ave
- 2218 S 11th Ave
- 912 W Roosevelt Rd Unit 1
- 2247 S 21st Ave
- 1511 Kemman Ave
- 2127 S 15th Ave
- 1531 Beach Ave
- 2921 S 13th Ave
- 2925 S 13th Ave
- 2917 S 13th Ave
- 2929 S 13th Ave
- 2913 S 13th Ave
- 2920 S 12th Ave
- 2933 S 13th Ave
- 2924 S 12th Ave
- 2909 S 13th Ave
- 2928 S 12th Ave
- 2912 S 12th Ave
- 2905 S 13th Ave
- 2932 S 12th Ave
- 2908 S 12th Ave
- 2904 S 12th Ave
- 2939 S 13th Ave Unit 2N
- 2939 S 13th Ave
- 2939 S 13th Ave Unit 1S
- 2939 S 13th Ave Unit 2S
- 2939 S 13th Ave Unit GS
Your Personal Tour Guide
Ask me questions while you tour the home.