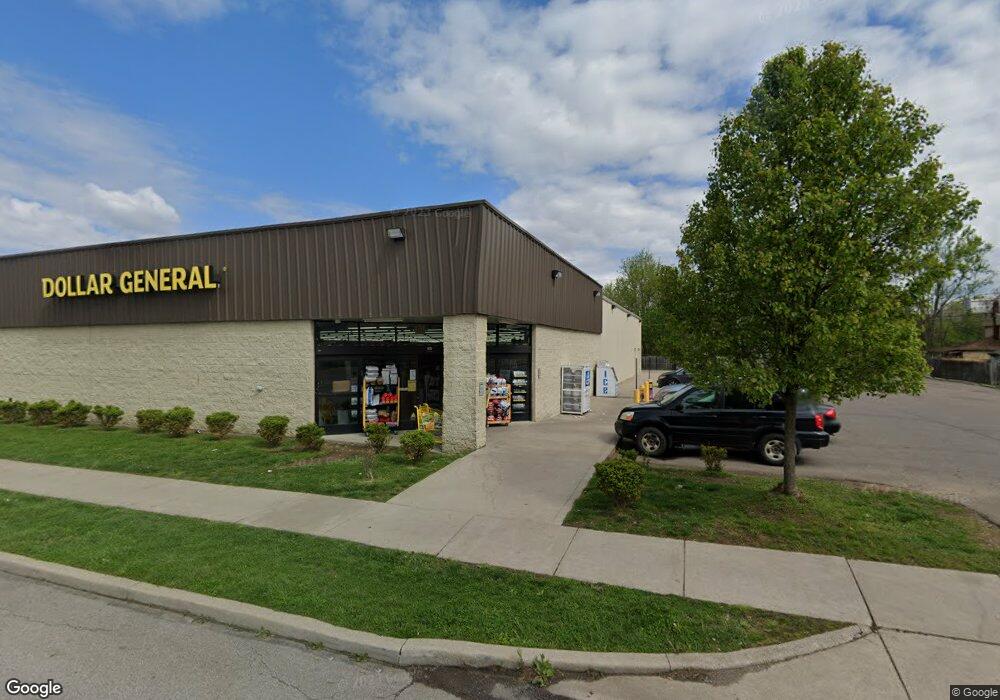
292 E Main St Newark, OH 43055
Estimated Value: $2,560,957
Studio
--
Bath
6,949
Sq Ft
$369/Sq Ft
Est. Value
About This Home
This home is located at 292 E Main St, Newark, OH 43055 and is currently estimated at $2,560,957, approximately $368 per square foot. 292 E Main St is a home located in Licking County with nearby schools including Ben Franklin Elementary School, Heritage Middle School, and Newark High School.
Ownership History
Date
Name
Owned For
Owner Type
Purchase Details
Closed on
Nov 25, 2019
Sold by
Cole Dg Newark Oh Llc
Bought by
Mdc Coast 19 Llc
Current Estimated Value
Purchase Details
Closed on
Mar 15, 2013
Sold by
Newark Dg Llc
Bought by
Cole Dg Newark Oh Llc
Purchase Details
Closed on
Aug 28, 2012
Sold by
Cochran Rolland D and Cochran Glendina
Bought by
Newark Dg Llc
Home Financials for this Owner
Home Financials are based on the most recent Mortgage that was taken out on this home.
Original Mortgage
$988,000
Interest Rate
3.59%
Mortgage Type
Commercial
Create a Home Valuation Report for This Property
The Home Valuation Report is an in-depth analysis detailing your home's value as well as a comparison with similar homes in the area
Home Values in the Area
Average Home Value in this Area
Purchase History
| Date | Buyer | Sale Price | Title Company |
|---|---|---|---|
| Mdc Coast 19 Llc | $1,499,800 | None Available | |
| Cole Dg Newark Oh Llc | $1,313,000 | Old Republic National Title | |
| Newark Dg Llc | $210,000 | None Available |
Source: Public Records
Mortgage History
| Date | Status | Borrower | Loan Amount |
|---|---|---|---|
| Previous Owner | Newark Dg Llc | $988,000 |
Source: Public Records
Tax History
| Year | Tax Paid | Tax Assessment Tax Assessment Total Assessment is a certain percentage of the fair market value that is determined by local assessors to be the total taxable value of land and additions on the property. | Land | Improvement |
|---|---|---|---|---|
| 2024 | $20,610 | $500,120 | $102,830 | $397,290 |
| 2023 | $26,644 | $500,120 | $102,830 | $397,290 |
| 2022 | $24,934 | $524,930 | $78,820 | $446,110 |
| 2021 | $26,269 | $524,930 | $78,820 | $446,110 |
| 2020 | $26,751 | $524,930 | $78,820 | $446,110 |
| 2019 | $14,028 | $273,010 | $71,650 | $201,360 |
| 2018 | $14,137 | $0 | $0 | $0 |
| 2017 | $13,416 | $0 | $0 | $0 |
| 2016 | $23,235 | $0 | $0 | $0 |
| 2015 | $23,789 | $0 | $0 | $0 |
| 2014 | $11,672 | $0 | $0 | $0 |
| 2013 | $11,920 | $0 | $0 | $0 |
Source: Public Records
Map
Nearby Homes
Your Personal Tour Guide
Ask me questions while you tour the home.