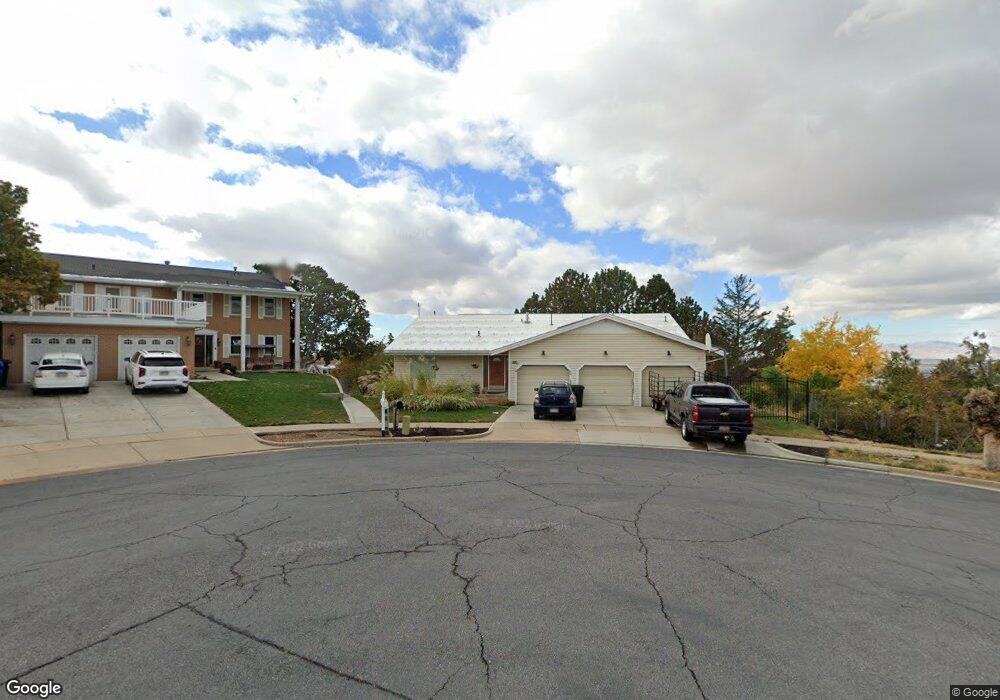
2920 S 450 E Bountiful, UT 84010
Estimated Value: $647,000 - $683,000
4
Beds
3
Baths
1,874
Sq Ft
$353/Sq Ft
Est. Value
About This Home
This home is located at 2920 S 450 E, Bountiful, UT 84010 and is currently estimated at $660,934, approximately $352 per square foot. 2920 S 450 E is a home located in Davis County with nearby schools including Boulton School, Mueller Park Junior High School, and Woods Cross High School.
Ownership History
Date
Name
Owned For
Owner Type
Purchase Details
Closed on
Dec 18, 2024
Sold by
Brown Darryl K and Brown Susan M
Bought by
Brown Family Revocable Living Trust and Brown
Current Estimated Value
Purchase Details
Closed on
Jan 31, 1996
Sold by
Green Clifton B and Green Pauline M
Bought by
Brown Darryl K and Brown Susan M
Home Financials for this Owner
Home Financials are based on the most recent Mortgage that was taken out on this home.
Original Mortgage
$90,000
Interest Rate
6.73%
Create a Home Valuation Report for This Property
The Home Valuation Report is an in-depth analysis detailing your home's value as well as a comparison with similar homes in the area
Purchase History
| Date | Buyer | Sale Price | Title Company |
|---|---|---|---|
| Brown Family Revocable Living Trust | -- | None Listed On Document | |
| Brown Darryl K | -- | Associated Title Company |
Source: Public Records
Mortgage History
| Date | Status | Borrower | Loan Amount |
|---|---|---|---|
| Previous Owner | Brown Darryl K | $90,000 |
Source: Public Records
Tax History
| Year | Tax Paid | Tax Assessment Tax Assessment Total Assessment is a certain percentage of the fair market value that is determined by local assessors to be the total taxable value of land and additions on the property. | Land | Improvement |
|---|---|---|---|---|
| 2025 | $3,895 | $354,750 | $117,760 | $236,990 |
| 2024 | $3,642 | $342,650 | $108,374 | $234,276 |
| 2023 | $3,530 | $603,000 | $199,144 | $403,856 |
| 2022 | $3,664 | $343,750 | $106,413 | $237,337 |
| 2021 | $3,274 | $470,000 | $158,388 | $311,612 |
| 2020 | $2,890 | $416,000 | $144,162 | $271,838 |
| 2019 | $2,876 | $404,000 | $136,187 | $267,813 |
| 2018 | $2,719 | $376,000 | $127,287 | $248,713 |
| 2016 | $2,220 | $165,495 | $57,373 | $108,122 |
| 2015 | $2,296 | $162,250 | $57,373 | $104,877 |
| 2014 | $2,226 | $161,718 | $57,373 | $104,345 |
| 2013 | -- | $142,897 | $61,874 | $81,023 |
Source: Public Records
Map
Nearby Homes
- 438 Indian Springs Rd
- 610 Meadowlark Ln
- 424 E Canyon Estates Dr S
- 69 E North Canyon Rd
- 2292 S 250 E
- 2273 S 200 E
- 19 E North Canyon Rd
- 761 San Simeon Way
- 110 2250 S
- 320 E 2100 S
- 831 E San Simeon Way S
- 3727 S 400 E
- 2053 S 350 E Unit 7
- 8 E 3500 S
- 2046 S 350 E Unit 4
- 3716 S Oakridge Cir
- 295 E 2050 S Unit 1
- 993 Canyon Creek Dr
- 296 E 2050 S Unit 2
- 2038 S 350 E Unit 3
Your Personal Tour Guide
Ask me questions while you tour the home.