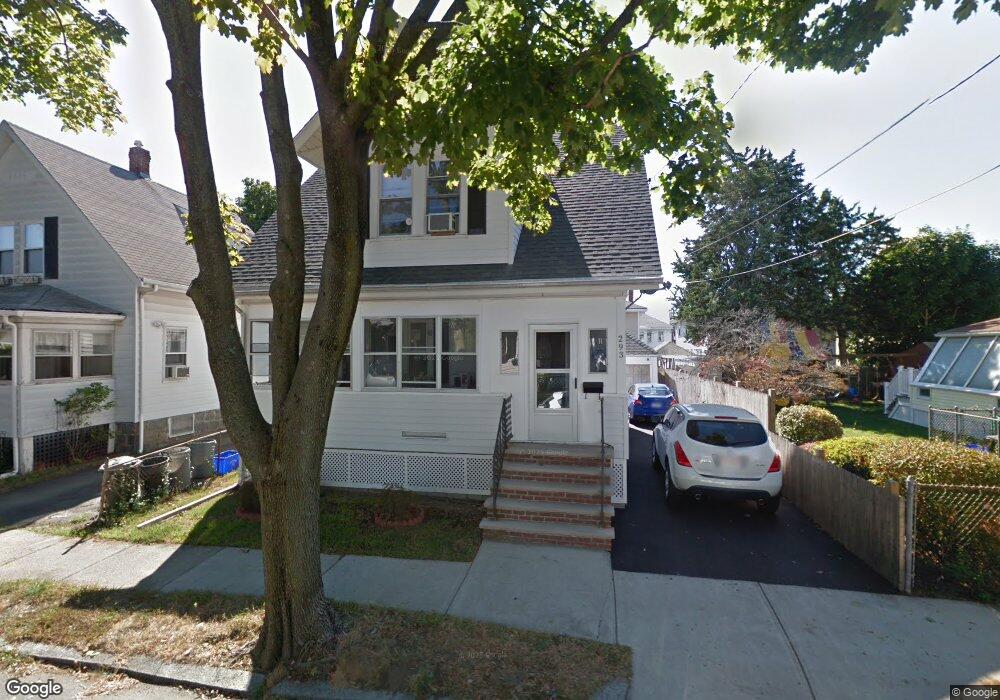
293 Atlantic St Quincy, MA 02171
North Quincy NeighborhoodEstimated Value: $684,250 - $818,000
3
Beds
1
Bath
1,482
Sq Ft
$500/Sq Ft
Est. Value
About This Home
This home is located at 293 Atlantic St, Quincy, MA 02171 and is currently estimated at $740,813, approximately $499 per square foot. 293 Atlantic St is a home located in Norfolk County with nearby schools including Squantum Elementary School, Atlantic Middle School, and North Quincy High School.
Ownership History
Date
Name
Owned For
Owner Type
Purchase Details
Closed on
Jan 27, 1987
Sold by
Shaw James J
Bought by
Eng Kwok Foo
Current Estimated Value
Home Financials for this Owner
Home Financials are based on the most recent Mortgage that was taken out on this home.
Original Mortgage
$70,000
Interest Rate
9.36%
Mortgage Type
Purchase Money Mortgage
Create a Home Valuation Report for This Property
The Home Valuation Report is an in-depth analysis detailing your home's value as well as a comparison with similar homes in the area
Home Values in the Area
Average Home Value in this Area
Purchase History
| Date | Buyer | Sale Price | Title Company |
|---|---|---|---|
| Eng Kwok Foo | $153,000 | -- |
Source: Public Records
Mortgage History
| Date | Status | Borrower | Loan Amount |
|---|---|---|---|
| Open | Eng Kwok Foo | $215,600 | |
| Closed | Eng Kwok Foo | $50,000 | |
| Closed | Eng Kwok Foo | $70,000 |
Source: Public Records
Tax History
| Year | Tax Paid | Tax Assessment Tax Assessment Total Assessment is a certain percentage of the fair market value that is determined by local assessors to be the total taxable value of land and additions on the property. | Land | Improvement |
|---|---|---|---|---|
| 2025 | $7,124 | $617,900 | $329,600 | $288,300 |
| 2024 | $6,936 | $615,400 | $329,600 | $285,800 |
| 2023 | $6,257 | $562,200 | $299,600 | $262,600 |
| 2022 | $5,905 | $492,900 | $239,700 | $253,200 |
| 2021 | $5,868 | $483,400 | $239,700 | $243,700 |
| 2020 | $5,815 | $467,800 | $235,000 | $232,800 |
| 2019 | $5,407 | $430,800 | $226,000 | $204,800 |
| 2018 | $5,495 | $411,900 | $215,200 | $196,700 |
| 2017 | $5,427 | $383,000 | $195,600 | $187,400 |
| 2016 | $5,198 | $362,000 | $177,900 | $184,100 |
| 2015 | $4,714 | $322,900 | $161,700 | $161,200 |
| 2014 | $4,526 | $304,600 | $161,700 | $142,900 |
Source: Public Records
Map
Nearby Homes
- 212 Quincy Shore Dr
- 175 Quincy Shore Dr Unit B33
- 18 Clark St
- 37 Bay State Rd Unit 37
- 27 Herbert Rd
- 43 Arnold Rd
- 90 Quincy Shore Dr Unit 803
- 156 Crabtree Rd
- 133 Commander Shea Blvd Unit 502
- 133 Commander Shea Blvd Unit 505
- 150 Hancock St Unit 101
- 153 Vassall St
- 151 Hancock St Unit 7
- 141 Bromfield St
- 17 Holmes St Unit 101
- 17 Holmes St Unit 1
- 63 Crabtree Rd
- 63 Crabtree Rd (Lot B)
- 63 Crabtree Rd (Lot A)
- 69 Bromfield St
- 287 Atlantic St
- 295 Atlantic St Unit single fam.
- 297 Atlantic St
- 297 Atlantic St Unit 297
- 24 Hovey St
- 24 Hovey St Unit 1
- 28 Hovey St
- 20 Hovey St
- 20 Hovey St Unit 20
- 32 Hovey St
- 292 Atlantic St
- 301 Atlantic St
- 303 Atlantic St
- 301 Atlantic St Unit 301
- 301 Atlantic St Unit 2
- 303 Atlantic St Unit 1
- 283 Atlantic St
- 298 Atlantic St
- 290 Atlantic St
- 16 Hovey St
Your Personal Tour Guide
Ask me questions while you tour the home.