293 Main St Amesbury, MA 01913
Amesbury AreaEstimated Value: $646,000 - $713,000
About This Home
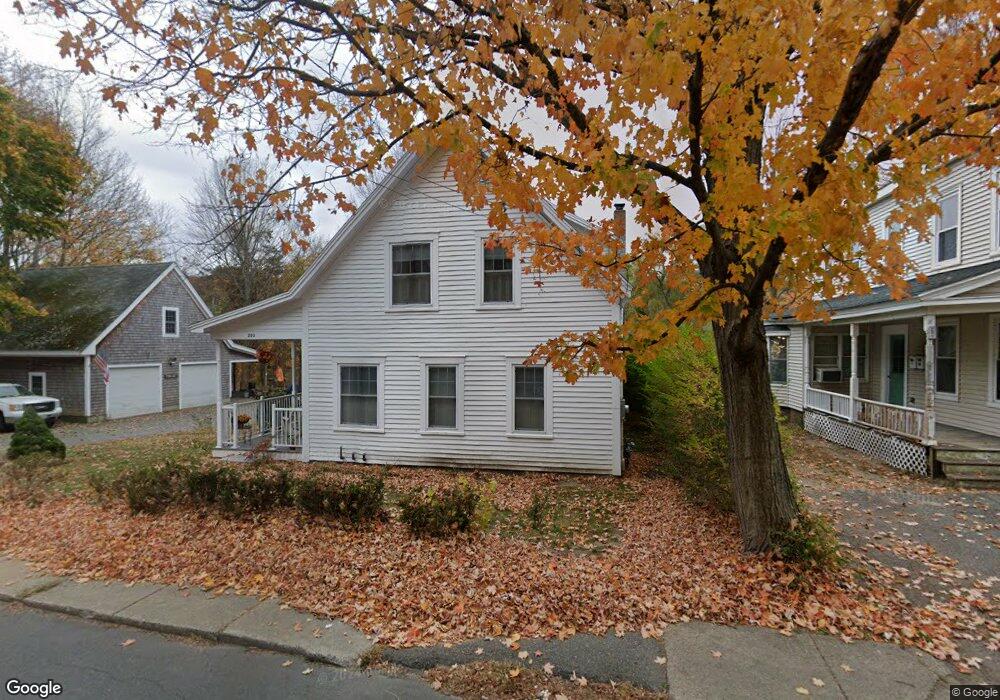
This home is located at 293 Main St, Amesbury, MA 01913 and is currently estimated at $686,251, approximately $460 per square foot. 293 Main St is a home located in Essex County with nearby schools including Amesbury High School and Amesbury Seventh-Day Adventist School.
Ownership History
We collect this data history from publicly available records. To have your information removed, we recommend requesting removal directly through your county’s website.
Purchase Details
Purchase Details
Home Values in the Area
Average Home Value in this Area
Purchase History
We collect this data history from publicly available records. To have your information removed, we recommend requesting removal directly through your county’s website.
| Date | Buyer | Sale Price | Title Company |
|---|---|---|---|
| -- | None Available | ||
| -- | -- |
Mortgage History
We collect this data history from publicly available records. To have your information removed, we recommend requesting removal directly through your county’s website.
| Date | Status | Borrower | Loan Amount |
|---|---|---|---|
| Previous Owner | $128,000 | ||
| Previous Owner | $70,000 |
Tax History
We collect this data history from publicly available records. To have your information removed, we recommend requesting removal directly through your county’s website.
| Year | Tax Paid | Tax Assessment Tax Assessment Total Assessment is a certain percentage of the fair market value that is determined by local assessors to be the total taxable value of land and additions on the property. | Land | Improvement |
|---|---|---|---|---|
| 2025 | $9,746 | $637,000 | $303,700 | $333,300 |
| 2024 | $9,307 | $595,100 | $287,200 | $307,900 |
| 2023 | $9,111 | $557,600 | $249,700 | $307,900 |
| 2022 | $8,532 | $482,300 | $218,800 | $263,500 |
| 2021 | $8,147 | $446,400 | $171,800 | $274,600 |
| 2020 | $7,308 | $425,400 | $165,700 | $259,700 |
| 2019 | $7,421 | $404,000 | $165,700 | $238,300 |
| 2018 | $7,235 | $381,000 | $157,700 | $223,300 |
| 2017 | $7,100 | $355,900 | $157,700 | $198,200 |
| 2016 | $6,946 | $342,500 | $157,700 | $184,800 |
Map
- 372 Main St
- 376 Main St Unit 4
- 382 Main St
- 52 Merrimac St
- 60 Merrimac St Unit 611
- 60 Merrimac St Unit 608
- 60 Merrimac St Unit 506
- 60 Merrimac St Unit 403
- 30 E Greenwood St
- 30 Hillside Ave
- 425 Main St
- 435 Main St
- 13 Cutter Ln Unit 13
- 25 Beacon St
- 21 Lafayette St
- 39 Beacon St
- 13 N Martin Rd
- 104 Main St Unit 2
- 8 School St
- 163 Elm St Unit 1
Ask me questions while you tour the home.