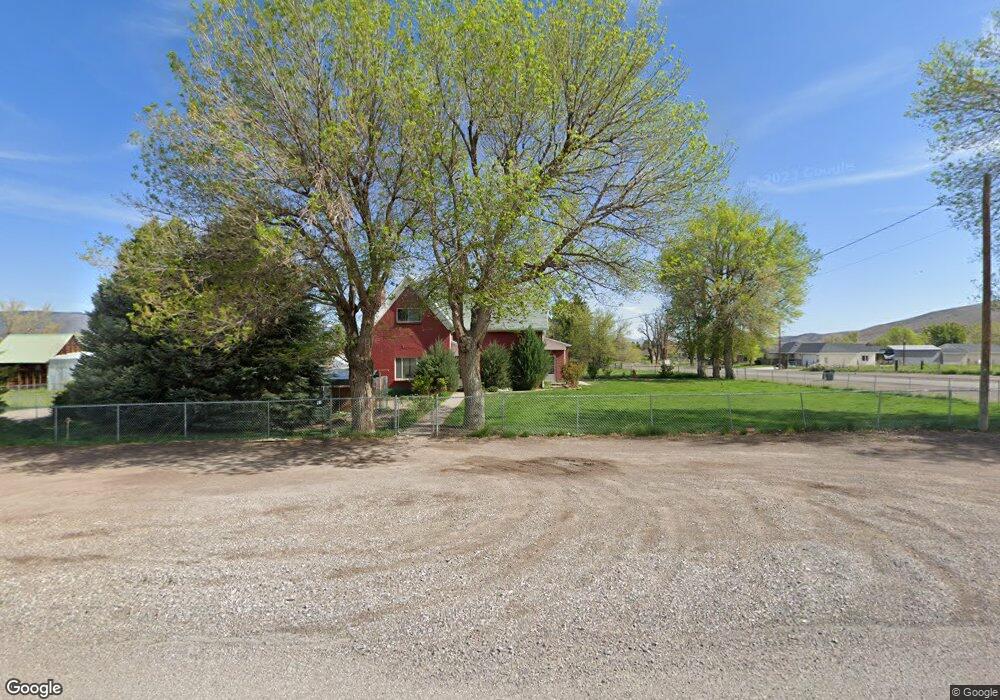
295 E 200 N Monroe, UT 84754
Monroe NeighborhoodEstimated Value: $356,894 - $470,000
4
Beds
3
Baths
1,776
Sq Ft
$221/Sq Ft
Est. Value
About This Home
This home is located at 295 E 200 N, Monroe, UT 84754 and is currently estimated at $392,224, approximately $220 per square foot. 295 E 200 N is a home located in Sevier County with nearby schools including Monroe School, South Sevier Middle School, and South Sevier High School.
Ownership History
Date
Name
Owned For
Owner Type
Purchase Details
Closed on
Jan 29, 2018
Sold by
Beck David N
Bought by
Taylor Don Blain and Taylor Carolyn
Current Estimated Value
Home Financials for this Owner
Home Financials are based on the most recent Mortgage that was taken out on this home.
Original Mortgage
$119,500
Outstanding Balance
$100,346
Interest Rate
3.93%
Mortgage Type
New Conventional
Estimated Equity
$291,878
Purchase Details
Closed on
Sep 14, 2013
Sold by
Beck Laura K
Bought by
Beck David N
Create a Home Valuation Report for This Property
The Home Valuation Report is an in-depth analysis detailing your home's value as well as a comparison with similar homes in the area
Home Values in the Area
Average Home Value in this Area
Purchase History
| Date | Buyer | Sale Price | Title Company |
|---|---|---|---|
| Taylor Don Blain | -- | First American Title Insuran | |
| Beck David N | -- | None Available |
Source: Public Records
Mortgage History
| Date | Status | Borrower | Loan Amount |
|---|---|---|---|
| Open | Taylor Don Blain | $119,500 |
Source: Public Records
Tax History
| Year | Tax Paid | Tax Assessment Tax Assessment Total Assessment is a certain percentage of the fair market value that is determined by local assessors to be the total taxable value of land and additions on the property. | Land | Improvement |
|---|---|---|---|---|
| 2025 | $1,347 | $149,555 | $41,154 | $108,401 |
| 2024 | $1,346 | $162,739 | $37,997 | $124,742 |
| 2023 | $1,346 | $150,767 | $37,053 | $113,714 |
| 2022 | $1,575 | $149,267 | $29,252 | $120,015 |
| 2021 | $1,320 | $103,510 | $21,183 | $82,327 |
| 2020 | $1,232 | $90,554 | $20,174 | $70,380 |
| 2019 | $1,090 | $84,100 | $18,160 | $65,940 |
| 2018 | $1,027 | $70,550 | $16,140 | $54,410 |
| 2017 | $962 | $68,620 | $17,350 | $51,270 |
| 2016 | $451 | $55,050 | $0 | $0 |
| 2015 | $451 | $44,360 | $0 | $0 |
| 2014 | $451 | $43,140 | $0 | $0 |
Source: Public Records
Map
Nearby Homes
Your Personal Tour Guide
Ask me questions while you tour the home.