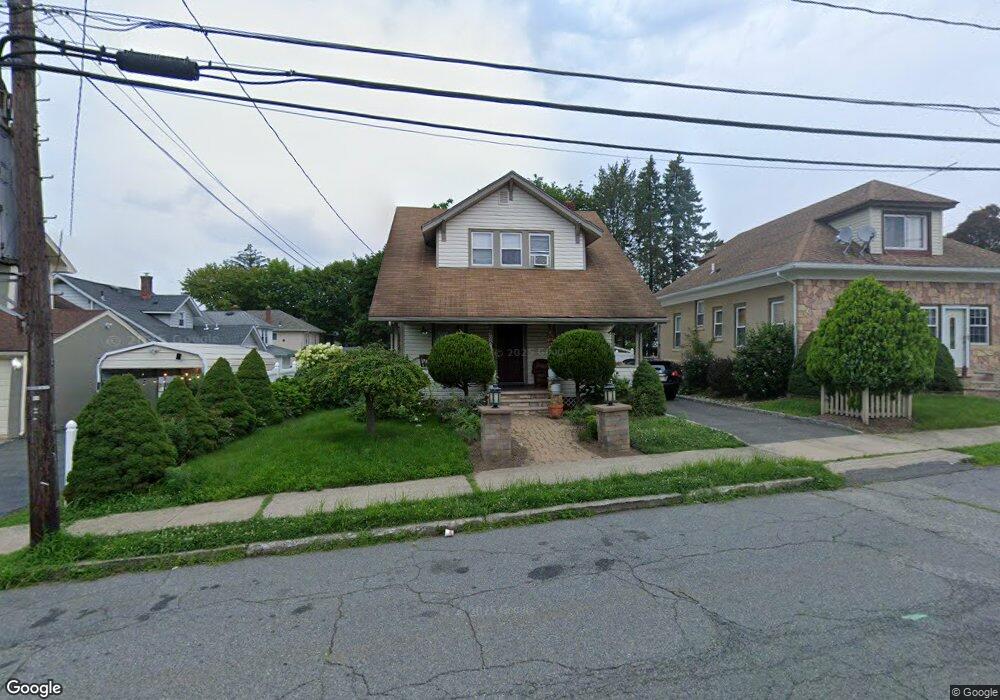
295 E Mcfarlan St Dover, NJ 07801
Dover AreaEstimated Value: $405,541 - $560,000
About This Home
This home is located at 295 E Mcfarlan St, Dover, NJ 07801 and is currently estimated at $498,385, approximately $391 per square foot. 295 E Mcfarlan St is a home located in Morris County with nearby schools including Dover Middle School and Dover High School.
Ownership History
We collect this data history from publicly available records. To have your information removed, we recommend requesting removal directly through your county’s website.
Purchase Details
Home Financials for this Owner
Home Financials are based on the most recent Mortgage that was taken out on this home.Purchase Details
Home Values in the Area
Average Home Value in this Area
Purchase History
We collect this data history from publicly available records. To have your information removed, we recommend requesting removal directly through your county’s website.
| Date | Buyer | Sale Price | Title Company |
|---|---|---|---|
| $355,000 | -- | ||
| $125,000 | Old Republic Natl Title Ins |
Mortgage History
We collect this data history from publicly available records. To have your information removed, we recommend requesting removal directly through your county’s website.
| Date | Status | Borrower | Loan Amount |
|---|---|---|---|
| Open | $284,000 |
Tax History
We collect this data history from publicly available records. To have your information removed, we recommend requesting removal directly through your county’s website.
| Year | Tax Paid | Tax Assessment Tax Assessment Total Assessment is a certain percentage of the fair market value that is determined by local assessors to be the total taxable value of land and additions on the property. | Land | Improvement |
|---|---|---|---|---|
| 2026 | $6,683 | $204,200 | $86,400 | $117,800 |
| 2025 | $6,683 | $204,200 | $86,400 | $117,800 |
| 2024 | $6,447 | $204,200 | $86,400 | $117,800 |
| 2023 | $6,447 | $204,200 | $86,400 | $117,800 |
| 2022 | $5,928 | $204,200 | $86,400 | $117,800 |
| 2021 | $5,928 | $204,200 | $86,400 | $117,800 |
| 2020 | $5,809 | $204,200 | $86,400 | $117,800 |
| 2019 | $5,569 | $204,200 | $86,400 | $117,800 |
| 2018 | $5,262 | $204,200 | $86,400 | $117,800 |
| 2017 | $5,023 | $204,200 | $86,400 | $117,800 |
| 2016 | $4,905 | $204,200 | $86,400 | $117,800 |
| 2015 | $5,569 | $271,000 | $114,500 | $156,500 |
| 2014 | $5,512 | $271,000 | $114,500 | $156,500 |
Map
- 105-107 Berry St
- 110-112 Berry St
- 17 E Cooper St
- 119 King St Unit 121
- 27 Belmont Ave
- 28 Mase Ave
- 130 Lincoln Ave
- 160 Lincoln Ave
- 8 N Salem St
- 5 Mary St
- 145 Elm St
- 164 E Blackwell St Unit 166
- 25 Passaic St
- 54 Highview Terrace
- 372-374 E Blackwell St
- 59 Livingston Ave
- 82 Pequannock St Unit 84
- 113 Pequannock St
- 19 Schindler Dr
- 32 Flintlock Terrace
- 297 E Mcfarlan St
- 165 Clark St
- 155 Clark St
- 153 Clark St
- 16 Jackson Ave
- 151 Clark St
- 1 Jackson Ave
- 1 Christopher St
- 301 E Mcfarlan St
- 123 Clark St
- 123 Clark St Unit B
- 18 Jackson Ave
- 3 Christopher St
- 136 Clark St Unit 140
- 142 Clark St Unit 146
- 305 E Mcfarlan St
- 132 Clark St
- 119 Clark St
- 5 Christopher St A B
- 128 Clark St
Ask me questions while you tour the home.