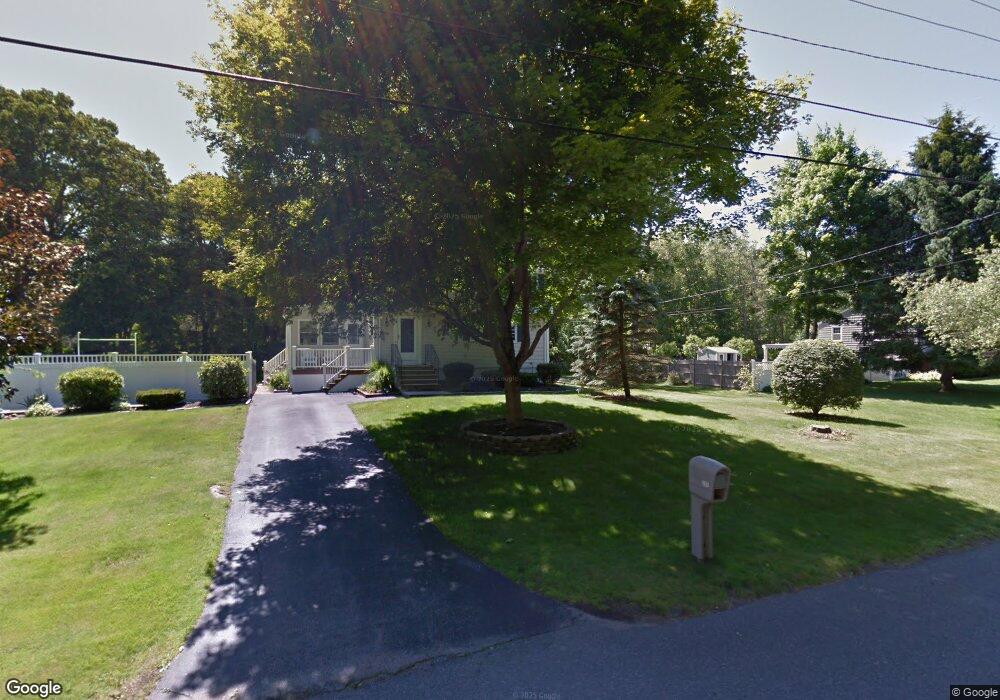
295 Old Town Way Hanover, MA 02339
Hanover AreaEstimated Value: $774,000 - $887,000
About This Home
This home is located at 295 Old Town Way, Hanover, MA 02339 and is currently estimated at $814,206, approximately $493 per square foot. 295 Old Town Way is a home located in Plymouth County with nearby schools including Hanover High School, South Shore Charter Public School, and Norwell KinderCare.
Ownership History
We collect this data history from publicly available records. To have your information removed, we recommend requesting removal directly through your county’s website.
Purchase Details
Home Financials for this Owner
Home Financials are based on the most recent Mortgage that was taken out on this home.Home Values in the Area
Average Home Value in this Area
Purchase History
We collect this data history from publicly available records. To have your information removed, we recommend requesting removal directly through your county’s website.
| Date | Buyer | Sale Price | Title Company |
|---|---|---|---|
| $390,000 | -- |
Mortgage History
We collect this data history from publicly available records. To have your information removed, we recommend requesting removal directly through your county’s website.
| Date | Status | Borrower | Loan Amount |
|---|---|---|---|
| Open | $50,000 | ||
| Closed | $293,000 | ||
| Closed | $304,000 | ||
| Closed | $278,168 | ||
| Closed | $312,000 | ||
| Previous Owner | $68,000 | ||
| Previous Owner | $42,000 | ||
| Previous Owner | $15,000 |
Tax History
We collect this data history from publicly available records. To have your information removed, we recommend requesting removal directly through your county’s website.
| Year | Tax Paid | Tax Assessment Tax Assessment Total Assessment is a certain percentage of the fair market value that is determined by local assessors to be the total taxable value of land and additions on the property. | Land | Improvement |
|---|---|---|---|---|
| 2025 | $8,009 | $648,500 | $270,400 | $378,100 |
| 2024 | $7,865 | $612,500 | $270,400 | $342,100 |
| 2023 | $7,213 | $534,700 | $245,800 | $288,900 |
| 2022 | $7,579 | $497,000 | $245,800 | $251,200 |
| 2021 | $7,433 | $455,200 | $223,400 | $231,800 |
| 2020 | $7,258 | $445,000 | $223,400 | $221,600 |
| 2019 | $7,069 | $430,800 | $223,400 | $207,400 |
| 2018 | $6,689 | $410,900 | $223,400 | $187,500 |
| 2017 | $5,332 | $393,300 | $211,900 | $181,400 |
| 2016 | $6,240 | $370,100 | $192,700 | $177,400 |
| 2015 | $5,977 | $370,100 | $192,700 | $177,400 |
Map
- 212 Spruce Way
- 38 Juniper Ln Unit 38
- 755 Main St
- 418 Webster St
- 46 Tower Hill Dr
- 11 Jutila Farm Path
- 978 Main St
- 4 Pleasant St
- 7 Assinippi Ave Unit 214
- 72 Beckford Farm Rd
- 86 Maplewood Dr
- 25 Buffum Rd
- 9 Douglas Ave
- 40 Longwater Dr
- 85 Maple Ave
- 7 Judith St
- 286 Mayflower Cir
- 114 Longwater Dr
- 178 Main St
- 6 Lydon Ln Unit C1
- 285 Old Town Way
- 270 Manns Dr
- 262 Manns Dr
- 313 Old Town Way
- 288 Old Town Way
- 273 Old Town Way
- 312 Old Town Way
- 220 Mann's Dr
- 26 Henderson Ln
- 248 Manns Dr
- 272 Old Town Way
- 327 Old Town Way
- 34 Henderson Ln
- 263 Old Town Way
- 253 Manns Dr
- 324 Old Town Way
- 259 Old Town Way
- 260 Old Town Way
- 234 Manns Dr
- 339 Old Town Way
Ask me questions while you tour the home.