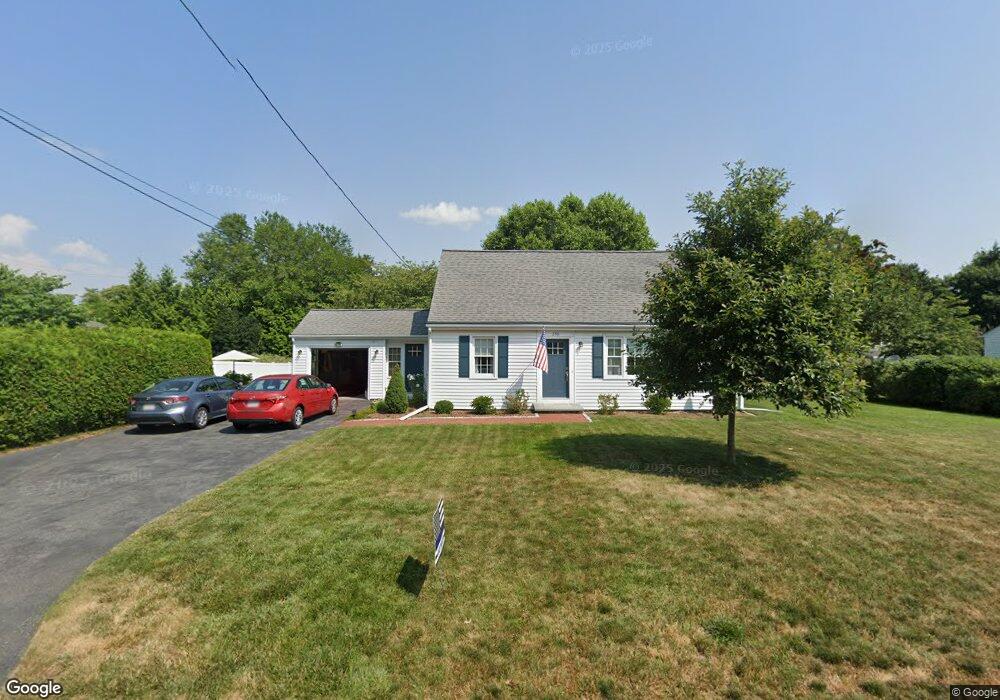
296 Anthony St Seekonk, MA 02771
Estimated Value: $473,913 - $567,000
3
Beds
2
Baths
1,428
Sq Ft
$374/Sq Ft
Est. Value
About This Home
This home is located at 296 Anthony St, Seekonk, MA 02771 and is currently estimated at $534,728, approximately $374 per square foot. 296 Anthony St is a home located in Bristol County with nearby schools including Seekonk High School, St Mary Academy-Bay View, and Providence Country Day School.
Ownership History
Date
Name
Owned For
Owner Type
Purchase Details
Closed on
Apr 15, 1998
Sold by
Ehnes Albert F
Bought by
Larimer Guy D and Larrimer Diane
Current Estimated Value
Home Financials for this Owner
Home Financials are based on the most recent Mortgage that was taken out on this home.
Original Mortgage
$118,750
Interest Rate
7.11%
Mortgage Type
Purchase Money Mortgage
Create a Home Valuation Report for This Property
The Home Valuation Report is an in-depth analysis detailing your home's value as well as a comparison with similar homes in the area
Home Values in the Area
Average Home Value in this Area
Purchase History
| Date | Buyer | Sale Price | Title Company |
|---|---|---|---|
| Larimer Guy D | $125,000 | -- | |
| Larimer Guy D | $125,000 | -- |
Source: Public Records
Mortgage History
| Date | Status | Borrower | Loan Amount |
|---|---|---|---|
| Open | Larimer Guy D | $114,000 | |
| Closed | Larimer Guy D | $118,750 |
Source: Public Records
Tax History
| Year | Tax Paid | Tax Assessment Tax Assessment Total Assessment is a certain percentage of the fair market value that is determined by local assessors to be the total taxable value of land and additions on the property. | Land | Improvement |
|---|---|---|---|---|
| 2025 | $4,684 | $379,300 | $153,000 | $226,300 |
| 2024 | $4,423 | $358,100 | $153,000 | $205,100 |
| 2023 | $4,233 | $322,900 | $129,900 | $193,000 |
| 2022 | $3,854 | $288,900 | $124,200 | $164,700 |
| 2021 | $3,593 | $269,900 | $109,000 | $160,900 |
| 2020 | $3,536 | $268,500 | $109,200 | $159,300 |
| 2019 | $3,251 | $236,300 | $104,100 | $132,200 |
| 2018 | $3,073 | $230,200 | $101,300 | $128,900 |
| 2017 | $3,150 | $221,200 | $98,700 | $122,500 |
| 2016 | $2,953 | $220,200 | $98,700 | $121,500 |
| 2015 | $2,874 | $217,200 | $98,700 | $118,500 |
Source: Public Records
Map
Nearby Homes
- 155 Sagamore Rd
- 57 Mohawk Dr
- 0 Sagamore Rd
- 9 Tammy Jean Dr
- 0 N Wheaton Ave
- 8 Agawam Ct
- 454 Fall River Ave
- 100 Bradley St
- 5 Luther Ave
- 267 Chestnut St
- 0 Wheaton Ave
- 3, 7, 11 Barney Ave Bldr Lot 7 8 9
- 209 Providence St Bldr Lot 1
- 205 Providence St Bldr Lot 3
- 203 Providence St Bldr Lot 5
- 702 Arcade Ave
- 105 Palmer River Rd
- 195 Barney Ave
- 296 Fall River Ave
- 85 Hospital Rd
Your Personal Tour Guide
Ask me questions while you tour the home.