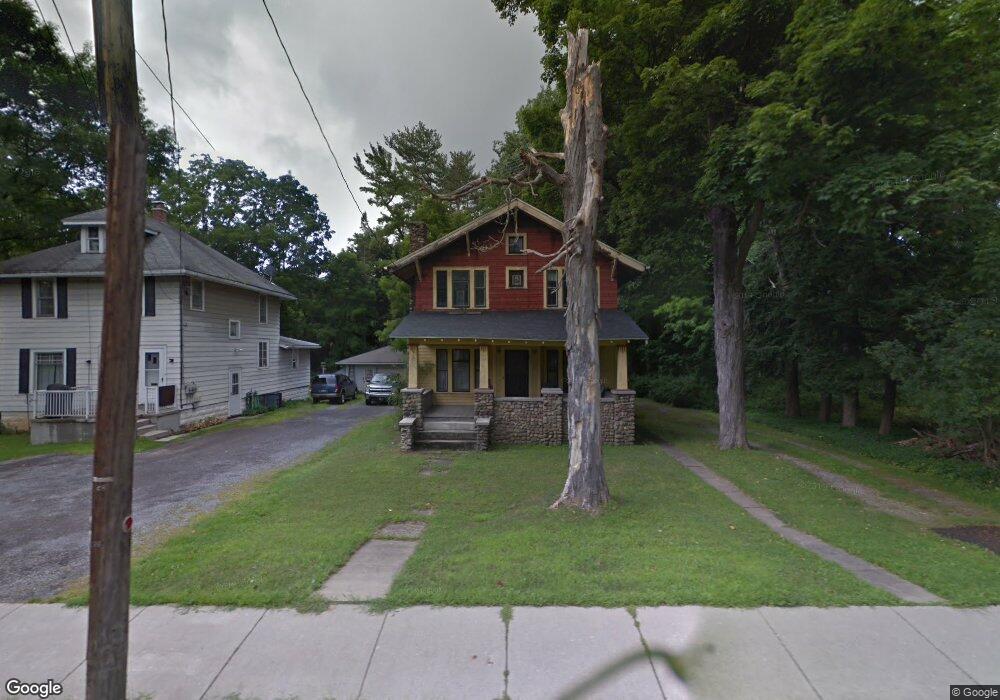
297 Olean St East Aurora, NY 14052
East Aurora AreaEstimated Value: $365,809 - $443,000
About This Home
This home is located at 297 Olean St, East Aurora, NY 14052 and is currently estimated at $391,202, approximately $246 per square foot. 297 Olean St is a home located in Erie County with nearby schools including Parkdale Elementary School, East Aurora Middle School, and East Aurora High School.
Ownership History
We collect this data history from publicly available records. To have your information removed, we recommend requesting removal directly through your county’s website.
Purchase Details
Purchase Details
Purchase Details
Home Values in the Area
Average Home Value in this Area
Purchase History
We collect this data history from publicly available records. To have your information removed, we recommend requesting removal directly through your county’s website.
| Date | Buyer | Sale Price | Title Company |
|---|---|---|---|
| -- | None Available | ||
| -- | None Available | ||
| -- | None Available |
Tax History
We collect this data history from publicly available records. To have your information removed, we recommend requesting removal directly through your county’s website.
| Year | Tax Paid | Tax Assessment Tax Assessment Total Assessment is a certain percentage of the fair market value that is determined by local assessors to be the total taxable value of land and additions on the property. | Land | Improvement |
|---|---|---|---|---|
| 2025 | $5,181 | $53,000 | $7,100 | $45,900 |
| 2024 | $5,181 | $53,000 | $7,100 | $45,900 |
| 2023 | $5,045 | $53,000 | $7,100 | $45,900 |
| 2022 | $4,973 | $53,000 | $7,100 | $45,900 |
| 2021 | $3,821 | $53,000 | $7,100 | $45,900 |
| 2020 | $1,209 | $53,000 | $7,100 | $45,900 |
| 2019 | $1,227 | $53,000 | $7,100 | $45,900 |
| 2018 | $1,379 | $53,000 | $7,100 | $45,900 |
| 2017 | $718 | $53,000 | $7,100 | $45,900 |
| 2016 | $1,228 | $53,000 | $7,100 | $45,900 |
| 2015 | -- | $53,000 | $7,100 | $45,900 |
| 2014 | -- | $53,000 | $7,100 | $45,900 |
Map
- 17 Nye Hill Rd
- 585 Linden Ave
- 861 Chestnut Hill Rd
- 277 Sycamore St
- 205 Blake Hill Rd
- 691 Oakwood Ave
- 733 Oakwood Ave
- 36 Temple Place
- 105 Park Place
- 262 Walnut St
- 67 Castle Hill Rd
- 120 Glenridge Rd
- 312 Center St
- 1823 Center St
- 771 Martin Dr
- 1215 Carriage Dr
- 266 Cazenovia St
- 40 W Gate Dr
- 305 Main St
- 277 Main St Unit 14C
Ask me questions while you tour the home.