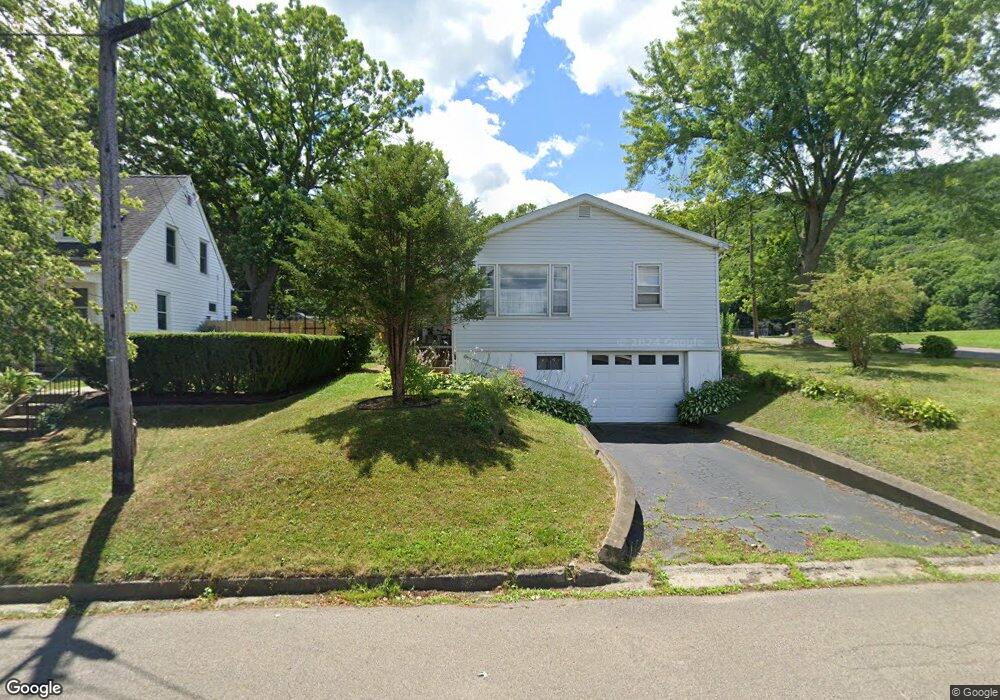
298 W 3rd St Corning, NY 14830
Estimated Value: $140,342 - $166,000
3
Beds
1
Bath
984
Sq Ft
$153/Sq Ft
Est. Value
About This Home
This home is located at 298 W 3rd St, Corning, NY 14830 and is currently estimated at $150,086, approximately $152 per square foot. 298 W 3rd St is a home located in Steuben County with nearby schools including Frederick Carder Elementary School, Corning-Painted Post Middle School, and Corning-Painted Post High School.
Ownership History
Date
Name
Owned For
Owner Type
Purchase Details
Closed on
Oct 27, 2023
Sold by
Roach Suzanne M
Bought by
Michaels Suzanne R and Jones Mary R
Current Estimated Value
Purchase Details
Closed on
Dec 21, 2004
Sold by
Mertson Joanne
Bought by
Roach Suzanne
Purchase Details
Closed on
Jul 25, 2003
Sold by
Cuda Joseph S Mark J
Bought by
Mertson Joanne C
Purchase Details
Closed on
Feb 18, 1999
Create a Home Valuation Report for This Property
The Home Valuation Report is an in-depth analysis detailing your home's value as well as a comparison with similar homes in the area
Home Values in the Area
Average Home Value in this Area
Purchase History
| Date | Buyer | Sale Price | Title Company |
|---|---|---|---|
| Michaels Suzanne R | -- | None Available | |
| Michaels Suzanne R | -- | None Available | |
| Roach Suzanne | $72,000 | -- | |
| Roach Suzanne | $72,000 | -- | |
| Mertson Joanne C | $72,000 | Daniel Gerwig | |
| Mertson Joanne C | $72,000 | Daniel Gerwig | |
| -- | -- | -- | |
| -- | -- | -- |
Source: Public Records
Tax History
| Year | Tax Paid | Tax Assessment Tax Assessment Total Assessment is a certain percentage of the fair market value that is determined by local assessors to be the total taxable value of land and additions on the property. | Land | Improvement |
|---|---|---|---|---|
| 2024 | $3,304 | $135,000 | $17,300 | $117,700 |
| 2023 | $3,748 | $135,000 | $17,300 | $117,700 |
| 2022 | $4,656 | $99,000 | $17,300 | $81,700 |
| 2021 | $3,425 | $99,000 | $17,300 | $81,700 |
| 2020 | $1,341 | $99,000 | $17,300 | $81,700 |
| 2019 | $2,809 | $99,000 | $17,300 | $81,700 |
| 2018 | $2,809 | $99,000 | $17,300 | $81,700 |
| 2017 | $1,695 | $99,000 | $17,300 | $81,700 |
| 2016 | $1,689 | $99,000 | $17,300 | $81,700 |
| 2015 | -- | $99,000 | $17,300 | $81,700 |
| 2014 | -- | $99,000 | $17,300 | $81,700 |
Source: Public Records
Map
Nearby Homes
Your Personal Tour Guide
Ask me questions while you tour the home.