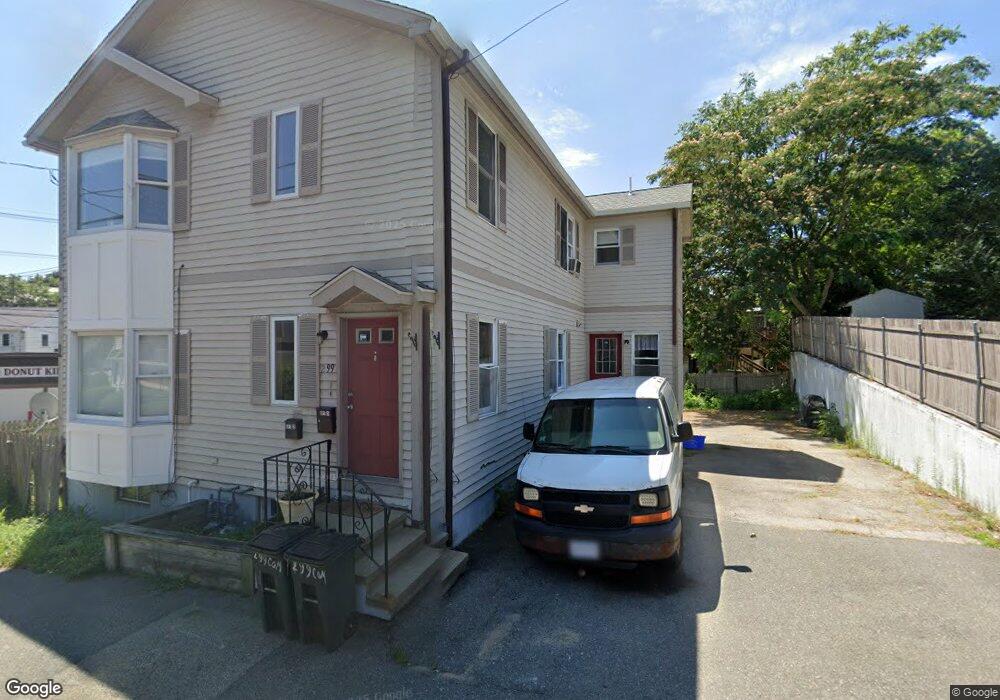
299 Common St Quincy, MA 02169
South Quincy NeighborhoodEstimated Value: $712,700 - $819,000
5
Beds
4
Baths
1,716
Sq Ft
$457/Sq Ft
Est. Value
About This Home
This home is located at 299 Common St, Quincy, MA 02169 and is currently estimated at $784,425, approximately $457 per square foot. 299 Common St is a home located in Norfolk County with nearby schools including South West Middle School, Lincoln-Hancock Community School, and Quincy High School.
Ownership History
Date
Name
Owned For
Owner Type
Purchase Details
Closed on
Oct 1, 2021
Sold by
Rosato Eva and Rosato Algerino
Bought by
Adhikary Rajiv and Adhikary Bhawana
Current Estimated Value
Home Financials for this Owner
Home Financials are based on the most recent Mortgage that was taken out on this home.
Original Mortgage
$461,250
Outstanding Balance
$420,617
Interest Rate
2.8%
Mortgage Type
Purchase Money Mortgage
Estimated Equity
$363,808
Purchase Details
Closed on
Nov 16, 2006
Sold by
299 Common Street Rt
Bought by
Rosato Algerino and Rosato Eva
Purchase Details
Closed on
Dec 29, 1992
Sold by
Quincy Sb
Bought by
Angelucci John
Home Financials for this Owner
Home Financials are based on the most recent Mortgage that was taken out on this home.
Original Mortgage
$121,500
Interest Rate
8.31%
Mortgage Type
Purchase Money Mortgage
Purchase Details
Closed on
Aug 24, 1992
Sold by
Melchione Rt Est
Bought by
Quincy Sb
Purchase Details
Closed on
May 3, 1989
Sold by
Boonisar Ann
Bought by
Melchione Rt
Home Financials for this Owner
Home Financials are based on the most recent Mortgage that was taken out on this home.
Original Mortgage
$70,000
Interest Rate
11.13%
Mortgage Type
Purchase Money Mortgage
Create a Home Valuation Report for This Property
The Home Valuation Report is an in-depth analysis detailing your home's value as well as a comparison with similar homes in the area
Home Values in the Area
Average Home Value in this Area
Purchase History
| Date | Buyer | Sale Price | Title Company |
|---|---|---|---|
| Adhikary Rajiv | $615,000 | None Available | |
| Rosato Algerino | -- | -- | |
| Angelucci John | $135,000 | -- | |
| Quincy Sb | $140,000 | -- | |
| Melchione Rt | $100,000 | -- |
Source: Public Records
Mortgage History
| Date | Status | Borrower | Loan Amount |
|---|---|---|---|
| Open | Adhikary Rajiv | $461,250 | |
| Previous Owner | Melchione Rt | $287,000 | |
| Previous Owner | Melchione Rt | $121,500 | |
| Previous Owner | Melchione Rt | $30,000 | |
| Previous Owner | Melchione Rt | $70,000 |
Source: Public Records
Tax History
| Year | Tax Paid | Tax Assessment Tax Assessment Total Assessment is a certain percentage of the fair market value that is determined by local assessors to be the total taxable value of land and additions on the property. | Land | Improvement |
|---|---|---|---|---|
| 2025 | $9,067 | $786,400 | $279,500 | $506,900 |
| 2024 | $8,895 | $789,300 | $266,100 | $523,200 |
| 2023 | $8,238 | $740,200 | $253,400 | $486,800 |
| 2022 | $7,871 | $657,000 | $202,800 | $454,200 |
| 2021 | $7,683 | $632,900 | $202,800 | $430,100 |
| 2020 | $7,433 | $598,000 | $202,800 | $395,200 |
| 2019 | $7,430 | $592,000 | $196,800 | $395,200 |
| 2018 | $6,443 | $483,000 | $182,300 | $300,700 |
| 2017 | $6,547 | $462,000 | $173,600 | $288,400 |
| 2016 | $6,125 | $426,500 | $157,800 | $268,700 |
| 2015 | $5,989 | $410,200 | $148,900 | $261,300 |
| 2014 | $5,910 | $397,700 | $148,900 | $248,800 |
Source: Public Records
Map
Nearby Homes
- 211 Copeland St
- 283 Copeland St
- 156 West St
- 91 Garfield St
- 211 West St Unit 11B
- 211 West St Unit 4B
- 211 West St Unit 12B
- 356 Quarry St
- 260 West St Unit 3
- 51 Branch St Unit 3
- 115 Bunker Hill Ln
- 14 Hall Place Unit 2
- 45 Colonial Dr
- 165 Whitwell St
- 312 Adams St
- 21 Totman St Unit 205
- 21 Totman St Unit 302
- 21 Totman St Unit 403
- 21 Totman St Unit 301
- 154 Glendale Rd Unit 2
- 293 Common St
- 161 Copeland St
- 4 Centre St Unit 3
- 289 Common St Unit 1
- 289 Common St
- 300 Common St
- 300 Common St Unit 1
- 302 Common St Unit 1
- 308 Common St
- 285 Common St
- 162 Copeland St
- 5-27 Centre
- 5 Centre St
- 162 Copeland St Unit 2
- 5 Centre St Unit 1
- 5 Centre St Unit 3
- 162 Copeland St Unit 3F
- 162 Copeland St Unit 3R
- 162 Copeland St Unit 1
- 165 Copeland St
Your Personal Tour Guide
Ask me questions while you tour the home.