299 Main St Keyport, NJ 07735
Estimated Value: $565,252 - $613,000
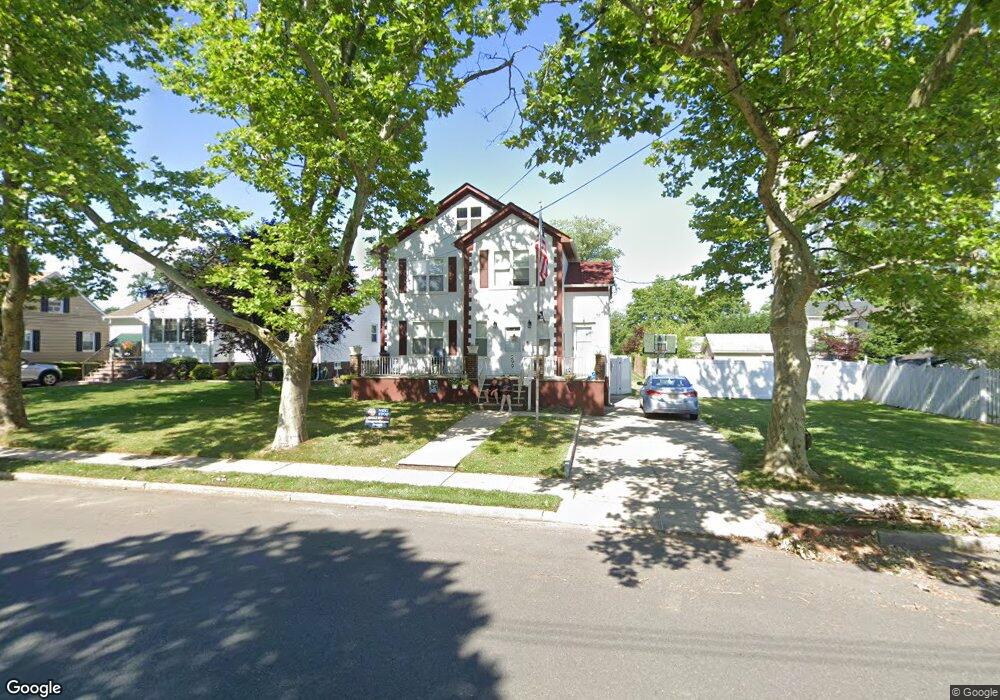
About This Home
This home is located at 299 Main St, Keyport, NJ 07735 and is currently estimated at $589,063, approximately $324 per square foot. 299 Main St is a home located in Monmouth County with nearby schools including Keyport Central School, Keyport High School, and Icob Academy.
Ownership History
We collect this data history from publicly available records. To have your information removed, we recommend requesting removal directly through your county’s website.
Purchase Details
Purchase Details
Purchase Details
Home Values in the Area
Average Home Value in this Area
Purchase History
We collect this data history from publicly available records. To have your information removed, we recommend requesting removal directly through your county’s website.
| Date | Buyer | Sale Price | Title Company |
|---|---|---|---|
| -- | Kantor Lawrence D | ||
| -- | None Available | ||
| -- | -- |
Tax History
We collect this data history from publicly available records. To have your information removed, we recommend requesting removal directly through your county’s website.
| Year | Tax Paid | Tax Assessment Tax Assessment Total Assessment is a certain percentage of the fair market value that is determined by local assessors to be the total taxable value of land and additions on the property. | Land | Improvement |
|---|---|---|---|---|
| 2025 | $9,342 | $477,400 | $224,100 | $253,300 |
| 2024 | $8,682 | $451,300 | $210,500 | $240,800 |
| 2023 | $8,682 | $395,000 | $191,400 | $203,600 |
| 2022 | $7,872 | $343,400 | $166,400 | $177,000 |
| 2021 | $7,872 | $311,900 | $148,600 | $163,300 |
| 2020 | $7,601 | $298,900 | $143,600 | $155,300 |
| 2019 | $7,381 | $290,700 | $138,900 | $151,800 |
| 2018 | $6,952 | $267,400 | $125,400 | $142,000 |
| 2017 | $7,579 | $290,700 | $125,400 | $165,300 |
| 2016 | $7,016 | $271,400 | $125,400 | $146,000 |
| 2015 | $6,999 | $269,500 | $125,400 | $144,100 |
| 2014 | $8,182 | $318,100 | $116,400 | $201,700 |
Map
- 209 Main St Unit 211
- 250 Broad St
- 12 Raritan Ave
- 231 Atlantic St Unit 30
- 231 Atlantic St Unit 59
- 231 Atlantic St Unit 39
- 4 231 Atlantic St Unit 39
- 314 Beers St
- 9 Hurley St
- 101 Perry St
- 38 Van Dorn St
- 39 Monroe St
- 212 Atlantic St
- 437 Atlantic St
- 14 Van Dorn St
- 226 Osborn St
- 2 Garden Terrace
- 51 Green Grove Ave
- 44 Beers St Unit A
- 9 Kearney St
Ask me questions while you tour the home.