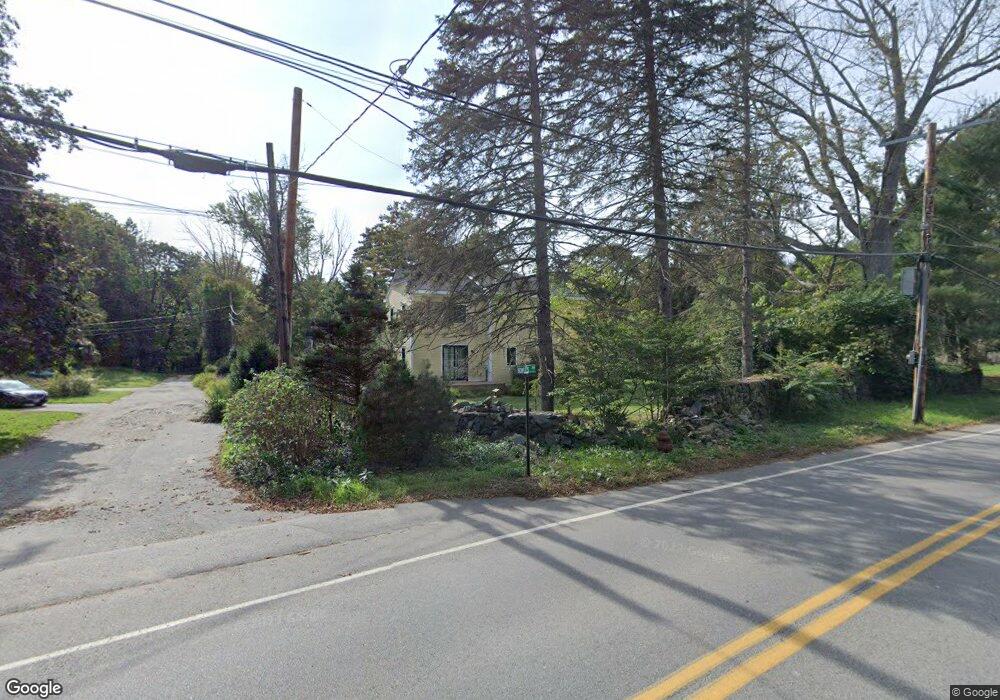
3 Bowles Terrace Lincoln, MA 01773
Estimated Value: $1,423,000 - $1,846,000
3
Beds
1
Bath
1,697
Sq Ft
$1,002/Sq Ft
Est. Value
About This Home
This home is located at 3 Bowles Terrace, Lincoln, MA 01773 and is currently estimated at $1,700,428, approximately $1,002 per square foot. 3 Bowles Terrace is a home located in Middlesex County with nearby schools including Lincoln-Sudbury Regional High School, Corwin-Russell School At Broccoli Hall, and The Cambridge School Of Weston.
Ownership History
Date
Name
Owned For
Owner Type
Purchase Details
Closed on
Jun 30, 2005
Sold by
Goddard Karen E and Goddard Richard B
Bought by
Lewandowski Marc S
Current Estimated Value
Home Financials for this Owner
Home Financials are based on the most recent Mortgage that was taken out on this home.
Original Mortgage
$359,600
Outstanding Balance
$188,564
Interest Rate
5.73%
Mortgage Type
Purchase Money Mortgage
Estimated Equity
$1,511,864
Create a Home Valuation Report for This Property
The Home Valuation Report is an in-depth analysis detailing your home's value as well as a comparison with similar homes in the area
Home Values in the Area
Average Home Value in this Area
Purchase History
| Date | Buyer | Sale Price | Title Company |
|---|---|---|---|
| Lewandowski Marc S | $550,000 | -- |
Source: Public Records
Mortgage History
| Date | Status | Borrower | Loan Amount |
|---|---|---|---|
| Open | Lewandowski Marc S | $359,600 |
Source: Public Records
Tax History
| Year | Tax Paid | Tax Assessment Tax Assessment Total Assessment is a certain percentage of the fair market value that is determined by local assessors to be the total taxable value of land and additions on the property. | Land | Improvement |
|---|---|---|---|---|
| 2025 | $195 | $1,524,600 | $593,500 | $931,100 |
| 2024 | $19,369 | $1,502,600 | $581,500 | $921,100 |
| 2023 | $18,775 | $1,348,800 | $547,500 | $801,300 |
| 2022 | $18,086 | $1,211,400 | $496,500 | $714,900 |
| 2021 | $16,600 | $1,069,600 | $428,500 | $641,100 |
| 2020 | $16,380 | $1,066,400 | $435,300 | $631,100 |
| 2019 | $14,507 | $1,034,000 | $421,000 | $613,000 |
| 2018 | $14,062 | $1,034,000 | $421,000 | $613,000 |
| 2017 | $13,866 | $1,012,100 | $408,800 | $603,300 |
| 2016 | $11,912 | $851,500 | $408,800 | $442,700 |
| 2015 | $7,832 | $553,500 | $346,900 | $206,600 |
| 2014 | $6,585 | $457,000 | $311,500 | $145,500 |
Source: Public Records
Map
Nearby Homes
- 130 Tower Rd
- 6 Clifford Ln
- 70 Todd Pond Rd
- 46 Blackburnian Rd
- 448 & 454 Concord Rd
- 14 Westland Rd
- 260 Lincoln Rd
- 35 Bemis St
- 63 Sudbury Rd
- 416 Conant Rd
- 40 Bakers Hill Rd
- 59 Bradyll Rd
- 291 Concord Rd
- 8 Silver Hill Rd
- 45 Weston Rd
- 302 Concord Rd
- 44 Baker Bridge Rd
- 15 Myles Standish Rd
- 48 Sunset Rd
- 183 Conant Rd
Your Personal Tour Guide
Ask me questions while you tour the home.