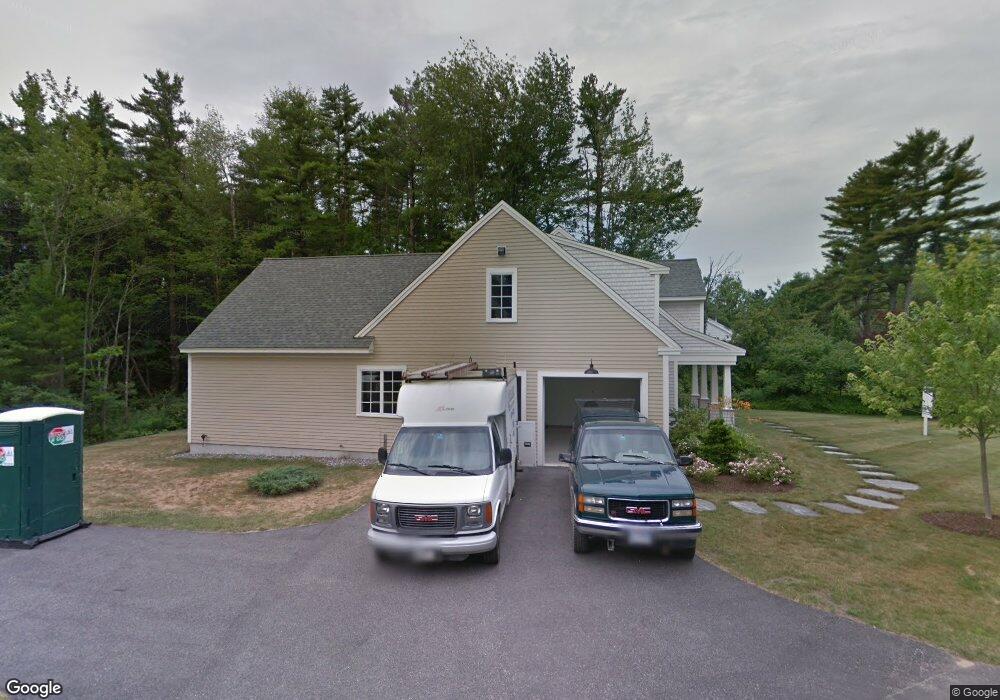
3 Bryce Ct Kennebunk, ME 04043
Estimated Value: $1,844,746 - $2,203,000
About This Home
This home is located at 3 Bryce Ct, Kennebunk, ME 04043 and is currently estimated at $1,988,937, approximately $740 per square foot. 3 Bryce Ct is a home located in York County with nearby schools including Kennebunk High School and The New School.
Ownership History
We collect this data history from publicly available records. To have your information removed, we recommend requesting removal directly through your county’s website.
Purchase Details
Home Financials for this Owner
Home Financials are based on the most recent Mortgage that was taken out on this home.Home Values in the Area
Average Home Value in this Area
Purchase History
We collect this data history from publicly available records. To have your information removed, we recommend requesting removal directly through your county’s website.
| Date | Buyer | Sale Price | Title Company |
|---|---|---|---|
| -- | -- |
Mortgage History
We collect this data history from publicly available records. To have your information removed, we recommend requesting removal directly through your county’s website.
| Date | Status | Borrower | Loan Amount |
|---|---|---|---|
| Open | $548,000 |
Tax History
We collect this data history from publicly available records. To have your information removed, we recommend requesting removal directly through your county’s website.
| Year | Tax Paid | Tax Assessment Tax Assessment Total Assessment is a certain percentage of the fair market value that is determined by local assessors to be the total taxable value of land and additions on the property. | Land | Improvement |
|---|---|---|---|---|
| 2025 | $19,097 | $1,938,800 | $1,220,700 | $718,100 |
| 2024 | $15,938 | $940,300 | $468,800 | $471,500 |
| 2023 | $15,092 | $940,300 | $468,800 | $471,500 |
| 2022 | $13,728 | $940,300 | $468,800 | $471,500 |
| 2021 | $13,399 | $940,300 | $468,800 | $471,500 |
| 2020 | $13,305 | $940,300 | $468,800 | $471,500 |
| 2019 | $3,493 | $940,300 | $468,800 | $471,500 |
| 2018 | $12,341 | $705,200 | $351,600 | $353,600 |
| 2017 | $3,354 | $705,200 | $351,600 | $353,600 |
| 2016 | $3,061 | $705,200 | $351,600 | $353,600 |
| 2015 | $9,445 | $617,300 | $263,700 | $353,600 |
| 2014 | $9,198 | $617,300 | $263,700 | $353,600 |
Map
- 16 Larboard Ln Unit 6
- 12 Wallace St
- 1 Ephraim Tyler Way Unit 1
- 7 Christensen Ln
- 3 Breakwater Ct Unit 1
- 12 Ephraim Tyler Way
- 20 Ephraim Tyler Way Unit 20
- 4 Commons Ln
- 3 Evergreen Ave
- 4 Cottagewood Ln
- 131 Western Ave
- 36 Bayberry Ave
- 97 Old Port Rd
- 147 Beach Ave Unit 42
- 175 Beach Ave Unit 2
- 221 Beach Ave
- 143 Beach Ave Unit 203
- 143 Beach Ave Unit 205
- 4 Elm St
- 85 Old Port Rd
Ask me questions while you tour the home.