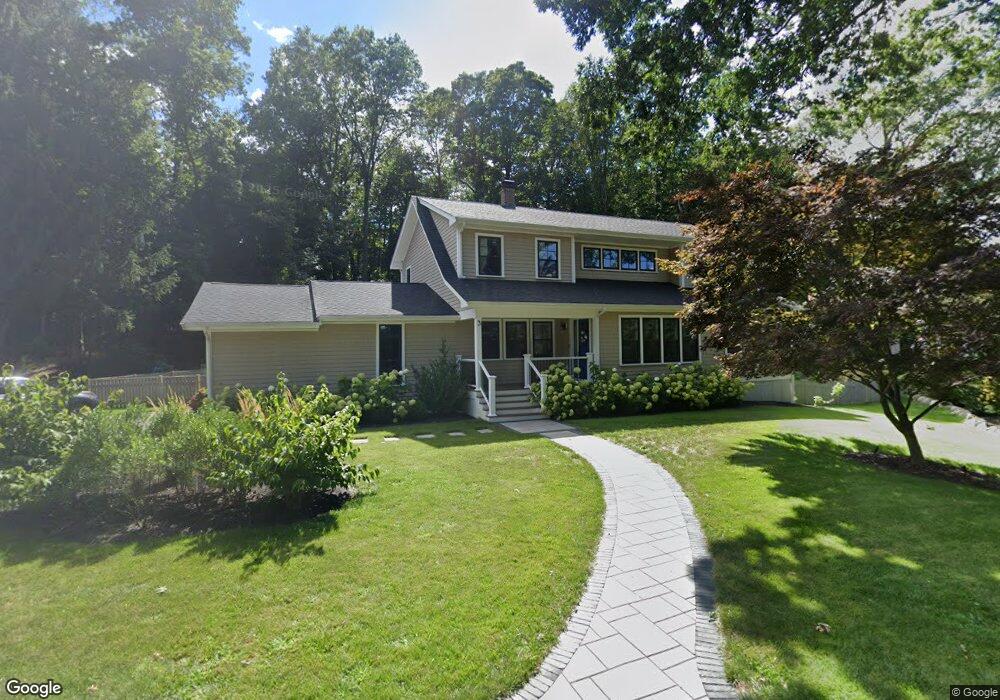
3 Bulow Place Hingham, MA 02043
Hingham AreaEstimated Value: $1,319,000 - $1,658,182
About This Home
This home is located at 3 Bulow Place, Hingham, MA 02043 and is currently estimated at $1,483,046, approximately $926 per square foot. 3 Bulow Place is a home located in Plymouth County with nearby schools including William L. Foster Elementary School, Hingham Middle School, and Hingham High School.
Ownership History
We collect this data history from publicly available records. To have your information removed, we recommend requesting removal directly through your county’s website.
Purchase Details
Purchase Details
Purchase Details
Home Financials for this Owner
Home Financials are based on the most recent Mortgage that was taken out on this home.Purchase History
We collect this data history from publicly available records. To have your information removed, we recommend requesting removal directly through your county’s website.
| Date | Buyer | Sale Price | Title Company |
|---|---|---|---|
| $381,000 | -- | ||
| -- | -- | ||
| -- | -- |
Mortgage History
We collect this data history from publicly available records. To have your information removed, we recommend requesting removal directly through your county’s website.
| Date | Status | Borrower | Loan Amount |
|---|---|---|---|
| Open | $100,000 | ||
| Open | $645,000 | ||
| Closed | $650,000 | ||
| Closed | $424,000 | ||
| Closed | $424,000 | ||
| Closed | $319,000 | ||
| Closed | $321,000 | ||
| Closed | $301,000 | ||
| Closed | $303,000 | ||
| Previous Owner | $60,000 | ||
| Previous Owner | $175,000 | ||
| Previous Owner | $100,000 |
Tax History
We collect this data history from publicly available records. To have your information removed, we recommend requesting removal directly through your county’s website.
| Year | Tax Paid | Tax Assessment Tax Assessment Total Assessment is a certain percentage of the fair market value that is determined by local assessors to be the total taxable value of land and additions on the property. | Land | Improvement |
|---|---|---|---|---|
| 2025 | $12,901 | $1,206,800 | $418,000 | $788,800 |
| 2024 | $11,342 | $1,045,300 | $418,000 | $627,300 |
| 2023 | $9,978 | $997,800 | $418,000 | $579,800 |
| 2022 | $10,746 | $929,600 | $360,600 | $569,000 |
| 2021 | $10,181 | $862,800 | $360,600 | $502,200 |
| 2020 | $5,993 | $519,800 | $360,600 | $159,200 |
| 2019 | $6,037 | $511,200 | $360,600 | $150,600 |
| 2018 | $7,033 | $493,800 | $360,600 | $133,200 |
| 2017 | $6,092 | $497,300 | $348,300 | $149,000 |
| 2016 | $6,004 | $480,700 | $331,700 | $149,000 |
| 2015 | $5,824 | $464,800 | $315,800 | $149,000 |
Map
- 60 Thaxter St
- 16 Bradley Woods Dr
- 16 Rhodes Place
- 19 Planters Field Ln
- 37 Foley Ct
- 54 Lincoln St
- 110 Uss Buckley Place
- 110 Uss Buckley Place Unit 2405
- 1905 Hockley Dr
- 246 North St
- 191 South St
- 103 Buckley Place Unit 2502
- 198 South St Unit A
- 3 Talbot Rd
- 190 South St Unit A
- 196 South St Unit A
- 101 Tuckers Ln
- 111 Wompatuck Rd
- 403 Tuckers Ln Unit 403
- 19 Hersey St
- 19 Harborview Dr
- 17 Harborview Dr
- 21 Harborview Dr
- 12 Harborview Dr
- 23 Harborview Dr
- 10 Harborview Dr
- 14 Harborview Dr
- 16 Harborview Dr
- 3 Summit Dr
- 7 Summit Dr
- 5 Summit Dr
- 25 Harborview Dr
- 5 Bulow Place
- 11 Harborview Dr
- 9 Summit Dr
- 18 Harborview Dr
- 27 Harborview Dr
- 1 Summit Dr
- 13 Summit Dr
- 20 Harborview Dr
Ask me questions while you tour the home.