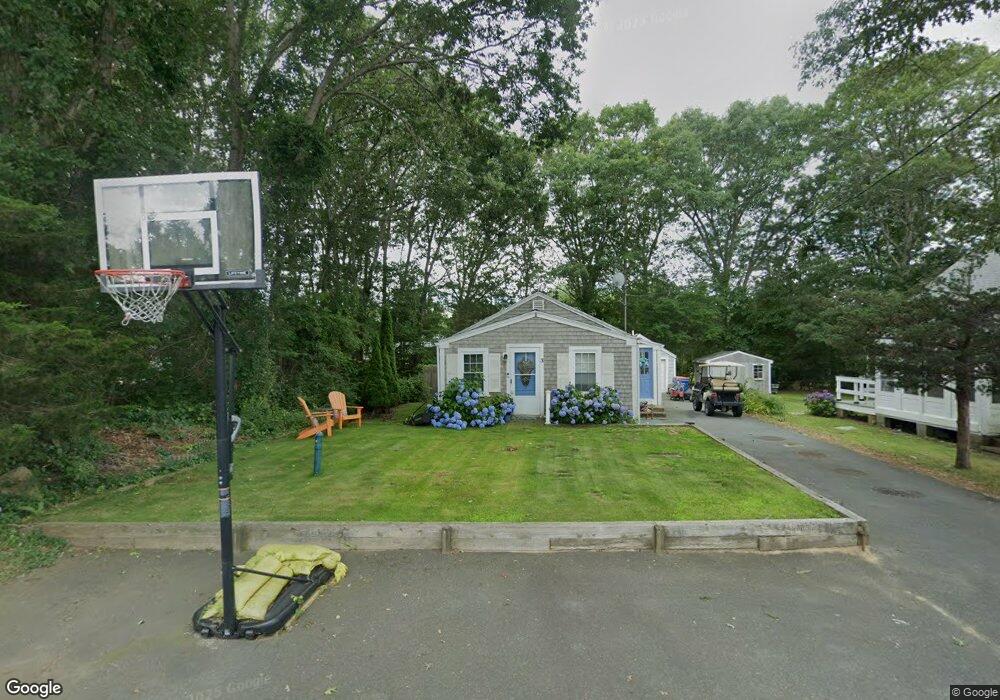
3 Cedar St Mattapoisett, MA 02739
Estimated Value: $442,675 - $491,000
2
Beds
1
Bath
880
Sq Ft
$536/Sq Ft
Est. Value
About This Home
This home is located at 3 Cedar St, Mattapoisett, MA 02739 and is currently estimated at $471,669, approximately $535 per square foot. 3 Cedar St is a home located in Plymouth County with nearby schools including Center School, Old Hammondtown Elementary, and Old Rochester Regional High School.
Ownership History
Date
Name
Owned For
Owner Type
Purchase Details
Closed on
Jul 22, 2020
Sold by
Obrien-Charis Laura
Bought by
Sauro Melinda J
Current Estimated Value
Purchase Details
Closed on
Jun 10, 2005
Sold by
Three Cedar Street Nt and Miller
Bought by
Pacella David and Pacella Tara
Purchase Details
Closed on
Feb 25, 2000
Sold by
Jackson Muriel Ej and Tansey Willard I
Bought by
Three Cedar St Nt and Miller
Create a Home Valuation Report for This Property
The Home Valuation Report is an in-depth analysis detailing your home's value as well as a comparison with similar homes in the area
Home Values in the Area
Average Home Value in this Area
Purchase History
| Date | Buyer | Sale Price | Title Company |
|---|---|---|---|
| Sauro Melinda J | $325,000 | None Available | |
| Pacella David | $286,000 | -- | |
| Pacella David | $286,000 | -- | |
| Three Cedar St Nt | $87,500 | -- |
Source: Public Records
Tax History
| Year | Tax Paid | Tax Assessment Tax Assessment Total Assessment is a certain percentage of the fair market value that is determined by local assessors to be the total taxable value of land and additions on the property. | Land | Improvement |
|---|---|---|---|---|
| 2025 | $3,551 | $330,000 | $185,100 | $144,900 |
| 2024 | $3,460 | $329,200 | $185,100 | $144,100 |
| 2023 | $3,533 | $314,061 | $180,961 | $133,100 |
| 2022 | $3,431 | $276,690 | $150,790 | $125,900 |
| 2021 | $3,108 | $239,822 | $131,122 | $108,700 |
| 2020 | $2,907 | $215,468 | $124,868 | $90,600 |
| 2019 | $2,801 | $212,000 | $124,900 | $87,100 |
| 2018 | $2,983 | $229,100 | $132,600 | $96,500 |
| 2017 | $3,068 | $234,700 | $143,600 | $91,100 |
| 2016 | $2,978 | $225,600 | $138,100 | $87,500 |
| 2015 | $2,703 | $207,900 | $130,400 | $77,500 |
| 2014 | $2,601 | $204,500 | $125,100 | $79,400 |
Source: Public Records
Map
Nearby Homes
Your Personal Tour Guide
Ask me questions while you tour the home.