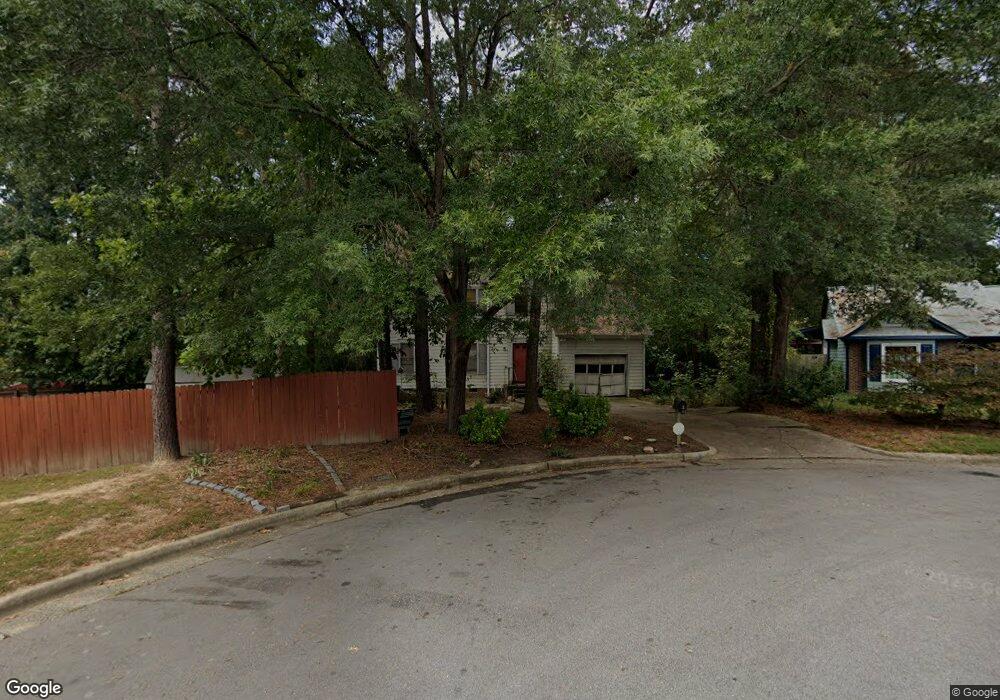
3 Chipley Ct Durham, NC 27703
Eastern Durham NeighborhoodEstimated Value: $361,000 - $375,000
4
Beds
3
Baths
1,961
Sq Ft
$188/Sq Ft
Est. Value
About This Home
This home is located at 3 Chipley Ct, Durham, NC 27703 and is currently estimated at $369,180, approximately $188 per square foot. 3 Chipley Ct is a home located in Durham County with nearby schools including Glenn Elementary, John W Neal Middle School, and Southern School of Energy & Sustainability.
Ownership History
Date
Name
Owned For
Owner Type
Purchase Details
Closed on
Oct 21, 2025
Sold by
Painter James Lanell
Bought by
Smith Lisa Painter
Current Estimated Value
Purchase Details
Closed on
Oct 25, 2000
Sold by
Crossmann Communities Of Nc Inc
Bought by
Lewis Laurie Ellen
Home Financials for this Owner
Home Financials are based on the most recent Mortgage that was taken out on this home.
Original Mortgage
$135,172
Interest Rate
7.82%
Create a Home Valuation Report for This Property
The Home Valuation Report is an in-depth analysis detailing your home's value as well as a comparison with similar homes in the area
Home Values in the Area
Average Home Value in this Area
Purchase History
| Date | Buyer | Sale Price | Title Company |
|---|---|---|---|
| Smith Lisa Painter | -- | None Listed On Document | |
| Lewis Laurie Ellen | $169,500 | -- |
Source: Public Records
Mortgage History
| Date | Status | Borrower | Loan Amount |
|---|---|---|---|
| Previous Owner | Lewis Laurie Ellen | $135,172 |
Source: Public Records
Tax History
| Year | Tax Paid | Tax Assessment Tax Assessment Total Assessment is a certain percentage of the fair market value that is determined by local assessors to be the total taxable value of land and additions on the property. | Land | Improvement |
|---|---|---|---|---|
| 2025 | $3,833 | $386,619 | $60,389 | $326,230 |
| 2024 | $2,639 | $189,189 | $25,420 | $163,769 |
| 2023 | $2,478 | $189,189 | $25,420 | $163,769 |
| 2022 | $2,421 | $189,189 | $25,420 | $163,769 |
| 2021 | $2,410 | $189,189 | $25,420 | $163,769 |
| 2020 | $2,353 | $189,189 | $25,420 | $163,769 |
| 2019 | $2,353 | $189,189 | $25,420 | $163,769 |
| 2018 | $2,205 | $162,579 | $25,420 | $137,159 |
| 2017 | $2,189 | $162,579 | $25,420 | $137,159 |
| 2016 | $2,115 | $162,579 | $25,420 | $137,159 |
| 2015 | $2,388 | $172,509 | $27,011 | $145,498 |
| 2014 | $2,388 | $172,509 | $27,011 | $145,498 |
Source: Public Records
Map
Nearby Homes
- 709 Grandview Dr
- 912 Obsidian Way
- 3613 Turquoise Dr
- 2004 Cross Bones Blvd
- 3201 Venus Dr
- 3708 Thornwood Dr
- 807 Outlaw Ave
- 507 Lodestone Dr
- 7 Mercury Ct
- 521 Quartz Dr
- 1026 Homecoming Way
- 3409 Judy Ave
- 209 Fountain St
- 1025 Sweet Cream Ct
- 217 Fountain St
- 608 Chalcedony Ct
- 502 Quartz Dr
- 3033 Fenimore St
- 1002 Alpha Dr
- 1113 Homecoming Way
Your Personal Tour Guide
Ask me questions while you tour the home.