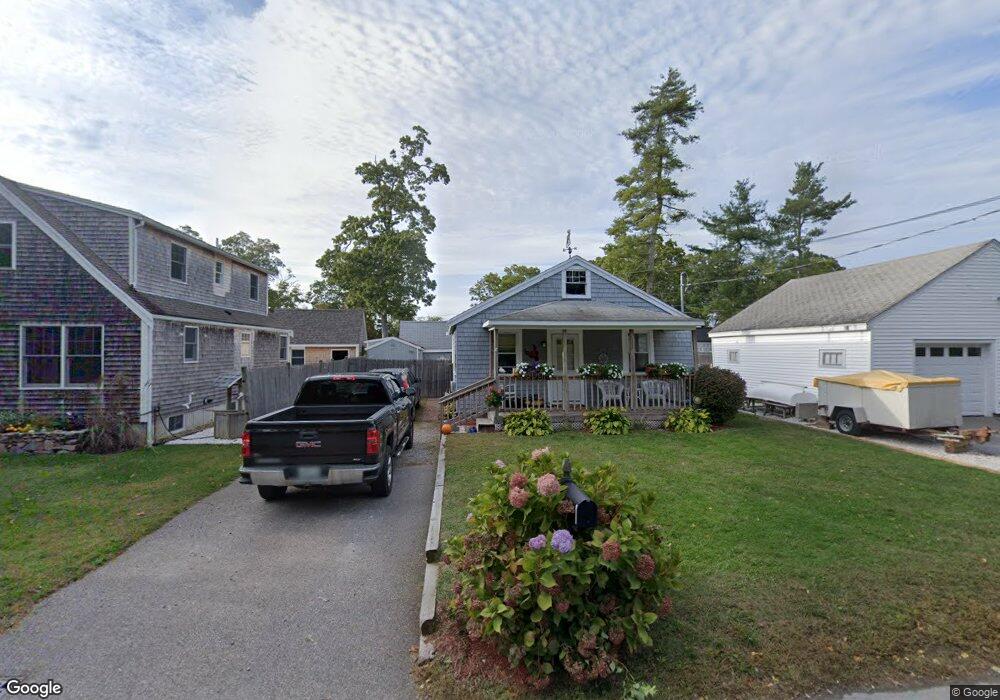
3 Datewood St Wareham, MA 02571
Estimated Value: $351,000 - $377,000
2
Beds
1
Bath
650
Sq Ft
$554/Sq Ft
Est. Value
About This Home
This home is located at 3 Datewood St, Wareham, MA 02571 and is currently estimated at $360,393, approximately $554 per square foot. 3 Datewood St is a home located in Plymouth County.
Ownership History
Date
Name
Owned For
Owner Type
Purchase Details
Closed on
Nov 19, 2004
Sold by
Pelletier Thomas B and Mather Jamie L
Bought by
Pelletier Jamie L and Pelletier Thomas B
Current Estimated Value
Purchase Details
Closed on
Aug 28, 1998
Sold by
Cote Douglas E
Bought by
Pelletier Thomas B and Mather Jamie L
Purchase Details
Closed on
Jun 30, 1995
Sold by
Morrison Arthur H
Bought by
Cote Douglas E
Create a Home Valuation Report for This Property
The Home Valuation Report is an in-depth analysis detailing your home's value as well as a comparison with similar homes in the area
Purchase History
| Date | Buyer | Sale Price | Title Company |
|---|---|---|---|
| Pelletier Jamie L | $83,000 | -- | |
| Pelletier Jamie L | $83,000 | -- | |
| Pelletier Thomas B | $83,000 | -- | |
| Pelletier Thomas B | $83,000 | -- | |
| Cote Douglas E | $52,000 | -- | |
| Cote Douglas E | $52,000 | -- |
Source: Public Records
Mortgage History
| Date | Status | Borrower | Loan Amount |
|---|---|---|---|
| Open | Cote Douglas E | $201,932 | |
| Closed | Cote Douglas E | $154,205 |
Source: Public Records
Tax History
| Year | Tax Paid | Tax Assessment Tax Assessment Total Assessment is a certain percentage of the fair market value that is determined by local assessors to be the total taxable value of land and additions on the property. | Land | Improvement |
|---|---|---|---|---|
| 2025 | $2,947 | $282,800 | $115,700 | $167,100 |
| 2024 | $2,957 | $263,300 | $87,500 | $175,800 |
| 2023 | $2,820 | $234,400 | $79,600 | $154,800 |
| 2022 | $2,607 | $197,800 | $79,600 | $118,200 |
| 2021 | $2,440 | $181,400 | $79,600 | $101,800 |
| 2020 | $2,321 | $175,000 | $79,600 | $95,400 |
| 2019 | $2,132 | $160,400 | $71,500 | $88,900 |
| 2018 | $4,786 | $152,400 | $71,500 | $80,900 |
| 2017 | $1,938 | $144,100 | $71,500 | $72,600 |
| 2016 | $1,726 | $127,600 | $65,000 | $62,600 |
| 2015 | $1,668 | $127,600 | $65,000 | $62,600 |
| 2014 | $1,717 | $133,600 | $70,900 | $62,700 |
Source: Public Records
Map
Nearby Homes
Your Personal Tour Guide
Ask me questions while you tour the home.