3 Dean Park Dr Unit 1 Springfield, IL 62707
Springfield AreaEstimated Value: $15,000 - $256,000
About This Home
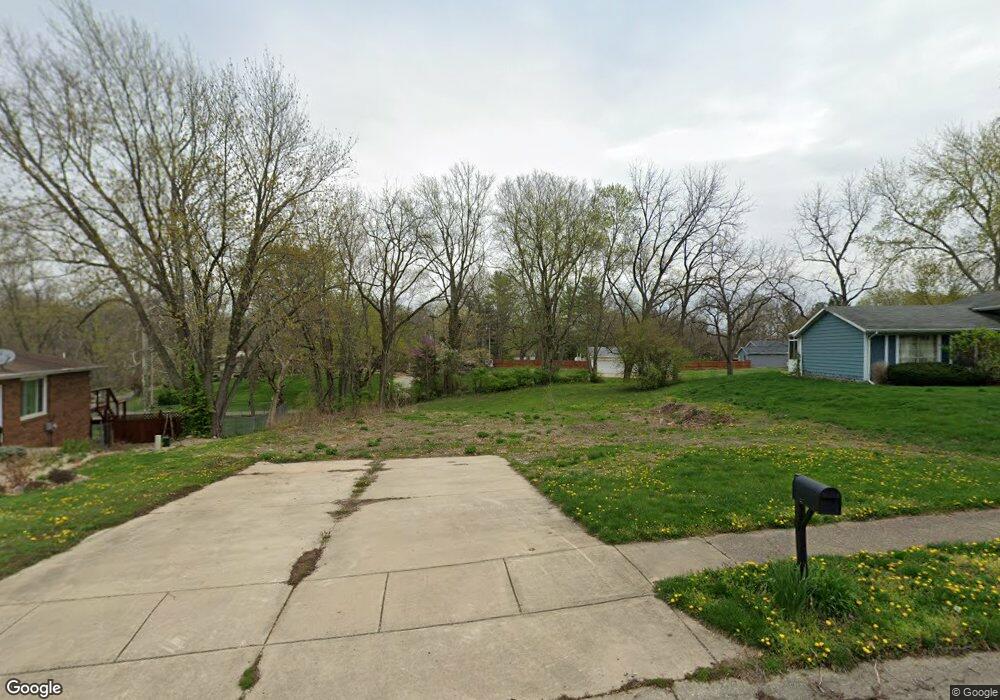
This home is located at 3 Dean Park Dr Unit 1, Springfield, IL 62707 and is currently estimated at $135,500, approximately $56 per square foot. 3 Dean Park Dr Unit 1 is a home located in Sangamon County with nearby schools including Rochester Elementary Ec-1 School, Rochester Elementary School, and Rochester Intermediate School.
Ownership History
We collect this data history from publicly available records. To have your information removed, we recommend requesting removal directly through your county’s website.
Purchase Details
Purchase Details
Purchase Details
Purchase Details
Purchase Details
Purchase History
We collect this data history from publicly available records. To have your information removed, we recommend requesting removal directly through your county’s website.
| Date | Buyer | Sale Price | Title Company |
|---|---|---|---|
| $16,000 | Wheatland Title | ||
| -- | None Listed On Document | ||
| -- | -- | ||
| -- | -- | ||
| $130,000 | -- |
Tax History
We collect this data history from publicly available records. To have your information removed, we recommend requesting removal directly through your county’s website.
| Year | Tax Paid | Tax Assessment Tax Assessment Total Assessment is a certain percentage of the fair market value that is determined by local assessors to be the total taxable value of land and additions on the property. | Land | Improvement |
|---|---|---|---|---|
| 2025 | $562 | $8,679 | $8,679 | $0 |
| 2024 | $539 | $8,150 | $8,150 | $0 |
| 2023 | $277 | $7,539 | $7,539 | $0 |
| 2022 | $316 | $10,534 | $7,017 | $3,517 |
| 2021 | $759 | $16,834 | $6,724 | $10,110 |
| 2020 | $746 | $16,726 | $6,681 | $10,045 |
| 2019 | $1,037 | $21,266 | $6,777 | $14,489 |
| 2018 | $3,951 | $63,548 | $6,651 | $56,897 |
| 2017 | $3,826 | $61,799 | $6,468 | $55,331 |
| 2016 | $3,716 | $59,900 | $6,269 | $53,631 |
| 2015 | $3,625 | $58,240 | $6,095 | $52,145 |
| 2014 | $3,101 | $57,328 | $6,000 | $51,328 |
| 2013 | $1,887 | $33,300 | $14,616 | $18,684 |
Map
- 6813 S Stephenson Ln Unit 1
- 26 Wind Cave Dr Unit 1
- 23 Crater Lake Dr Unit 1
- 49 Etherton Ln Unit 1
- 54 Longview Dr Unit 1
- 45 Longview Dr Unit 1
- 01 Mechanicsburg Rd
- 6105 Farrier Place
- 501 Jostes Rd Unit 1
- 485 Pakey Rd Unit 1
- 1225 Stanton Airport Rd
- 0 N Oaklane Rd
- 000 Oak Crest Rd
- 0 E Lincoln St
- 35 Galahad Dr Unit 1
- 415 Spring Ridge
- 400 N Park St
- 2436 Normal Dr
- 408 Parkview Dr Unit 1
- 328 Parkview Dr Unit 1
- 2 Dean Park Dr Unit 1
- 1 Dean Park Dr Unit 1
- 37 Dean Park Dr Unit 1
- 4 Dean Park Dr Unit 1
- 38 Dean Park Dr Unit 1
- 6765 Mechanicsburg Rd Unit 1
- 36 Dean Park Dr Unit 1
- 90 Sidener Ln Unit 1
- 64 Stephenson Ln Unit 1
- 96 Sidener Ln Unit 1
- 35 Dean Park Dr Unit 1
- 6781 Mechanicsburg Rd Unit 1
- 96 Sidnener Ln
- 6760 Mechanicsburg Rd Unit 1
- 6671 Mechanicsburg Rd Unit 1
- 110 Sidener Ln Unit 1
- 34 Dean Park Dr Unit 1
- 33 Dean Park Dr Unit 1
- 6782 Mechanicsburg Rd Unit 1
- 110 Stephenson Ln Unit 1
Ask me questions while you tour the home.