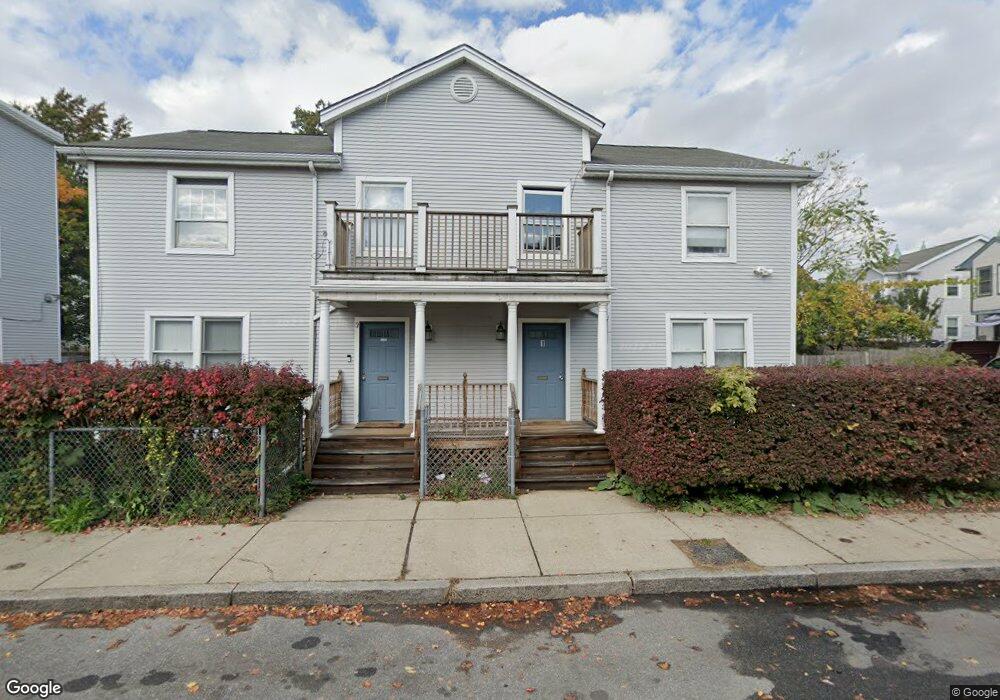
3 Dennis St Roxbury, MA 02119
Dudley-Brunswick King NeighborhoodEstimated Value: $325,000 - $621,000
3
Beds
2
Baths
1,384
Sq Ft
$324/Sq Ft
Est. Value
About This Home
This home is located at 3 Dennis St, Roxbury, MA 02119 and is currently estimated at $448,661, approximately $324 per square foot. 3 Dennis St is a home located in Suffolk County with nearby schools including Dudley Street Neighborhood Charter School and City on a Hill Charter Public School.
Ownership History
Date
Name
Owned For
Owner Type
Purchase Details
Closed on
Aug 12, 2016
Sold by
Dni Winthrop Estates L
Bought by
Holdi Dudley Neighbors
Current Estimated Value
Purchase Details
Closed on
Dec 30, 2005
Sold by
Dudley Neighbors Inc
Bought by
Dni Winthrop Ests Llc
Create a Home Valuation Report for This Property
The Home Valuation Report is an in-depth analysis detailing your home's value as well as a comparison with similar homes in the area
Home Values in the Area
Average Home Value in this Area
Purchase History
We collect this data history from publicly available records. To have your information removed, we recommend requesting removal directly through your county’s website.
| Date | Buyer | Sale Price | Title Company |
|---|---|---|---|
| Holdi Dudley Neighbors | -- | -- | |
| Holdi Dudley Neighbors | -- | -- | |
| Dni Winthrop Ests Llc | -- | -- |
Source: Public Records
Tax History
| Year | Tax Paid | Tax Assessment Tax Assessment Total Assessment is a certain percentage of the fair market value that is determined by local assessors to be the total taxable value of land and additions on the property. | Land | Improvement |
|---|---|---|---|---|
| 2025 | $2,765 | $238,800 | $78,804 | $159,996 |
| 2024 | $2,479 | $227,400 | $61,398 | $166,002 |
| 2023 | $2,326 | $216,600 | $58,482 | $158,118 |
| 2022 | $2,245 | $206,300 | $55,701 | $150,599 |
| 2021 | $2,097 | $196,500 | $0 | $196,500 |
| 2020 | $1,976 | $187,104 | $80,600 | $106,504 |
| 2019 | $1,789 | $169,700 | $81,500 | $88,200 |
| 2018 | $1,694 | $161,600 | $81,500 | $80,100 |
| 2017 | $1,630 | $153,900 | $81,500 | $72,400 |
| 2016 | $1,613 | $146,600 | $81,400 | $65,200 |
| 2015 | $1,691 | $139,620 | $68,700 | $70,920 |
| 2014 | $1,673 | $132,971 | $68,700 | $64,271 |
Source: Public Records
Map
Nearby Homes
- 101 Mount Pleasant Ave
- 18 Albion St Unit 2
- 92 George St Unit 203
- 92 George St Unit 202
- 1 Copeland Place
- 62 Winthrop St Unit 2
- 10 Forest St
- 50 Perrin St
- 2-4 Howard Place
- 7 Langford Park Unit 1
- 33 Copeland St Unit C
- 47 Julian St Unit 2
- 301-305 Dudley St
- 9 Batchelder St Unit 1
- 299 Dudley St
- 50 Clifford St
- 12 Forest St
- 29 Woodford St Unit 1
- 25 Hillsboro St Unit 1
- 216 Blue Hill Ave
Your Personal Tour Guide
Ask me questions while you tour the home.